You are using an out of date browser. It may not display this or other websites correctly.
You should upgrade or use an alternative browser.
You should upgrade or use an alternative browser.
Tubbs
The link provided by Hooya is the Yahoo 5 day chart. If you look at this chart and compare to-days volume with th volume shown on the 1 day chart you will see it is completely different.
The 1 day volume chart is incorrect.
Regards
bracke
The link provided by Hooya is the Yahoo 5 day chart. If you look at this chart and compare to-days volume with th volume shown on the 1 day chart you will see it is completely different.
The 1 day volume chart is incorrect.
Regards
bracke
Good morning all.
Thursday 9.30 am
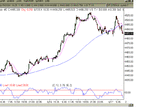
Attached chart is 5 min.
Quick round trip...
Has the index put in a lower high?
Ma's have caught up and if the support lows of 4482-5 break they'll be pointing down...
The next scenario is a consolidation that could become a mid point for the next (measured ?) move up....
Today could just end up consolidating yesterdays move before the next leg, up or down commences. Then you can throw in tomorrows option expiration--but I suspect most of that action has already taken place....
Thoughts/ comments ?
Regards,
KJH
Attachments
john joachim
Junior member
- Messages
- 10
- Likes
- 0
Hooya said:Hate to quote myself but fancied abit of self appreciation.... 😎
Hope everyone has a good weekend and enjoys tht footy
Hi Hooya,
Similar day I closed my long at 8.33
Waiting to close my short Futures high volume at 9.45
JOE
Remember it is Triple Witching in the US to-day-( expiry of index, options etc)
Overnight trading not going to be helpful:
Japan's Nikkei 225 Stock Average shed 2.1 percent, its biggest slide in a month, to 11,367.62.
South Korea's Kospi index lost 3.2 percent to 736.23.
Hong Kong's Hang Seng Index dropped 2.2 percent to 11,820.74 and the Hang Seng China Enterprises Index slumped for a fifth day.
This thread has gone mightly quiet
ftse is holding above yesterdays close of 4493, which surprise. surprise was also the pivot produced by yesterdays figures. Each day this week has produced a higher pivot namely 4449, 4451, 4485, 4493.
Perhaps someone would care to comment on the significance, if there is one.
Regards
bracke
ftse is holding above yesterdays close of 4493, which surprise. surprise was also the pivot produced by yesterdays figures. Each day this week has produced a higher pivot namely 4449, 4451, 4485, 4493.
Perhaps someone would care to comment on the significance, if there is one.
Regards
bracke
leeshindig
Active member
- Messages
- 140
- Likes
- 0
everyones on hooyas advfn pbb thread....only a fiver a month for access to premium bulletin board....
much more lively...
much more lively...
Similar threads
- Replies
- 1
- Views
- 1K
- Replies
- 1
- Views
- 1K
- Replies
- 2
- Views
- 2K

