You are using an out of date browser. It may not display this or other websites correctly.
You should upgrade or use an alternative browser.
You should upgrade or use an alternative browser.
peterpr
Established member
- Messages
- 609
- Likes
- 7
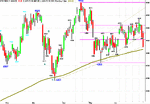
mully said:In recent weeks the FTSE 100 has flirted with its 200 day MA. It has found support each time.
I keep both 50 and 200 day MA's on my historical charts and note an inexorable approach towards the 200. It's been trading well below this morning and has only done so for single days on 27th March and 17th May since May 2003. It may hold today but not optimistic beyond the next week or so. The 200 is still on a very slight upward trend but its declining tragectory has been fairly smooth for months. Both the Dow & SPX are now trading well below their 200 MA's.
peterpr
Established member
- Messages
- 609
- Likes
- 7
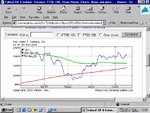
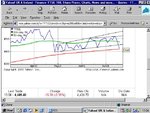
bracke said:Peterpr
"Both the Dow & SPX are now trading well below their 200 MA's."
You have confused me with the above. The chart below shows the opposite, am I missing something ?
Regards
bracke
Bracke - sorry - I posted the correction before I saw your last post - You've got it spot on
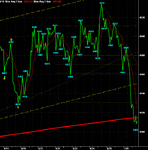
I have been looking at the estimated targets that a lot of us have posted and compared these with the fib grid 4601/4291 and see the retracement of .786=4358.
Over the months the ftse 100 has retraced .786 on a number of occasions.
Some of us are very bearish to day,so lets see how it goes.
Over the months the ftse 100 has retraced .786 on a number of occasions.
Some of us are very bearish to day,so lets see how it goes.
SoupDragon
Junior member
- Messages
- 13
- Likes
- 0
gaps still at 4309 and 4357 to fill btw.
mully
(
So does that make it a self-forecasting level. Because it is a closely watched level if enough people think it will stay above the level they will buy and keep it above.
If not enough people buy it will fall below and because of its supposed importance people will assume it will fall further and they will sell.
Notwithstanding the manipulators who pull it one way or the other to create a false situation before reversing the flow
Regards
bracke
(
PS: Do not think there is anything magical about 200 day other than lots of people watch it)
So does that make it a self-forecasting level. Because it is a closely watched level if enough people think it will stay above the level they will buy and keep it above.
If not enough people buy it will fall below and because of its supposed importance people will assume it will fall further and they will sell.
Notwithstanding the manipulators who pull it one way or the other to create a false situation before reversing the flow
Regards
bracke
SoupDragon
Junior member
- Messages
- 13
- Likes
- 0
...would have go back a bit...just have them writen on a piece of paper but with out trying to mke you feel silly 🙂 or me for stating the obvious but as they are unfilled gaps. I guess they are from the last time we traded at that level so just have to go back until you hit 4357🙂
SoupDragon
From my records 26 March
btw I feel silly on a regular basis so nothing new on that front !
Regards
bracke
I guess they are from the last time we traded at that level so just have to go back until you hit 4357🙂
From my records 26 March
btw I feel silly on a regular basis so nothing new on that front !
Regards
bracke
Last edited:
I'm surprised that we haven't seen a bounce from these lows especially off the 4400 level which may bode more weakness next week, 4381 is mynext level for sep
Not got position over weekend as still dazed from some of my stupidity this week, not holding good trdes long enough and holding bad trades too long has lead to a negative return this week but then i guess i'm not alone there
good weekend all i'm off for a few beers...................better make it wetherspoon given this weeks earnings.......
mully said:Bracke
"All patterns on the market are meaningless- unless confirmed. Once confirmed they remain of some note until negated."
You have read the book (page 183)
Confirmed by what, the price rising / falling ? and does the pattern have to be confimed each and every time ?
Is it not fair to say that from previous experience a certain feature eg 200dma is a watershed and should be watched closely until the pattern is confirmed.
Regards
bracke
Last edited:
Similar threads
- Replies
- 0
- Views
- 2K
- Replies
- 0
- Views
- 2K
- Replies
- 13
- Views
- 4K


