You are using an out of date browser. It may not display this or other websites correctly.
You should upgrade or use an alternative browser.
You should upgrade or use an alternative browser.
peterpr
Established member
- Messages
- 609
- Likes
- 7
barjon said:bracke/oatman
Did you notice the massive volume spike at the death (if it can be believed)? At nearly 300m when the average was under 20m and the earlier 3 significant spikes not even approaching 100m. That's a hell'va lot of short covering :cheesy:
The index proper still went down another 10+ points with the auction though. Interesting juncture eh?
Splasher,
I try not to have a view. However, I'll admit that I've felt it's been overvalued for a few months now. I don't analyse. That stance wouldn't have done me any good 🙄 I look for opportunities rather than position taking. I'm just as comfortable being short as long, so long as it moves. It's under pressure at the moment but I doubt it'll be a sustained move (famous last words). Looks to me that it got itself too long for no apparent reason. People do love to buy a market 😉 Continuous friendly sentiment. No bad news about. It's got top heavy so we're having a shake out.
I try not to have a view. However, I'll admit that I've felt it's been overvalued for a few months now. I don't analyse. That stance wouldn't have done me any good 🙄 I look for opportunities rather than position taking. I'm just as comfortable being short as long, so long as it moves. It's under pressure at the moment but I doubt it'll be a sustained move (famous last words). Looks to me that it got itself too long for no apparent reason. People do love to buy a market 😉 Continuous friendly sentiment. No bad news about. It's got top heavy so we're having a shake out.
peterpr
Established member
- Messages
- 609
- Likes
- 7
Feeling somewhat chastened with a residual long still open I was trawling around the US sites when I came across this. Another scary one.
http://www.safehaven.com/article-1690.htm
It was posted on 28th June and gets the post FOMC announcement market spot on. Right now I rather wish I'd read it a couple of days ago. Might have made me a little less impetuous.
http://www.safehaven.com/article-1690.htm
It was posted on 28th June and gets the post FOMC announcement market spot on. Right now I rather wish I'd read it a couple of days ago. Might have made me a little less impetuous.
Good morning All,
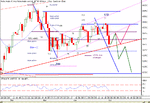
Comments refer to the EOD chart attached.
15 days down from Apr 23 high to Apr 30 low = 111 points
Move down from June 28 high to yesterdays low 110 points thus far.
Biggest retracement since the low that started the sideways ( bearish flag? ) move on May17.
A couple of scenarios in Green and Pink from yesterdays low.
Intra day yesterday looks like it has capitulated and a retest of the break down levels are on the cards. Any short fall of these levels will add to the downward momentum should that eventuate next week.
have a good day & weekend.
Regards,
KJH
Attachments
SoupDragon
Junior member
- Messages
- 13
- Likes
- 0
Morning KJH
Last night I had worked out the same down move as you from 4601 and got a target of 4298.
Cannot show chart because I worked on a hard copy by hand.
Recently I have been concentrating on the short term intraday stuff and did not look at the bigger picture.
Furtunately I have been flat over the last few days,but almost went long yesterday ,but by good fortune,I was out doing some shopping.
Regards
Regards
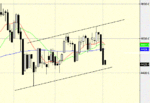
Sure is ......and the lower T/L also,SoupDragon said:worth watching this too...????
(you know the one I'm thinking of.....!)
Fluke,
That 4296-8 level is certainly on the cards. I'd expect it to be broken if the market is going to move up from there longer term. Just to prove it is support and take out any remaining stops.
KJH
SoupDragon
Junior member
- Messages
- 13
- Likes
- 0
I do indeed
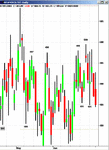
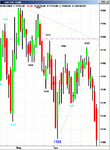
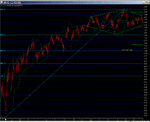
Am I the only one to see a diamond top in the process of forming on the daily chart? If it breaks the current uptrend any day so it gives a minimum downside target of 4100, which is also the 38% retracement of the rally from March 2003. The last time I saw one of these was during 1999 on the FTSE100, although it was on a larger and longer time scale..
The other horizontal lines are levels where I have written strangles in recent months.
The other horizontal lines are levels where I have written strangles in recent months.
Attachments
SoupDragon
Junior member
- Messages
- 13
- Likes
- 0
not alone 🙂 Hooya posted something similar on here on 17th
notice how it is slightly different expecting it to be more drawn out..and more symmetrical. So we have loads of possibilities but first we must sort out this oversold nature next week.
http://www.tacticaltrader.com/download.php?id=2381
notice how it is slightly different expecting it to be more drawn out..and more symmetrical. So we have loads of possibilities but first we must sort out this oversold nature next week.
http://www.tacticaltrader.com/download.php?id=2381
Last edited:
Reffering to the Trend Line posted on soup dragons chart.bracke said:KJH
"Sure is ......and the lower T/L also,
(you know the one I'm thinking of.....!)"
Can you explain the above please?
Regards
bracke
There is also a longer term trendline just below it that is not on the chart he put up...
kjh
Similar threads
- Replies
- 0
- Views
- 2K
- Replies
- 0
- Views
- 2K
- Replies
- 13
- Views
- 4K

