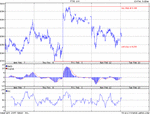
FTSE system

smccreedy said:
I'm afraid that view is a little simplistic as many markets have individual traits that will make them behave differently. Your assertion that everyone is investing in a direction to make profit is simply not true in all cases. Take for one the case of central banks defending key areas in FX for political reasons rather than trading reasons.

Think over some of these too:

The DJIA has only 30 stocks compared to the S&P500 and FTSE100 that of course makes it more volatile to the moves on one or two companies.


The DJIA isn't opened or closed by auction like the FTSE but using SOQ that places a value of the open after it's opened buy looking at prices after the first five mins of trade. The same on the close, it isn't an equilibrium like the FTSE of buyers and sellers it's a formula for what prices stocks traded at. This sounds fussy but does make a difference to how you read the data compared to say FTSE open and close figures.


FX trades nearly 24/7 as such strategy would have to take into account these extended hours.


FX also is needed in the real world, unlike say Vodafone stock so certain transactions have to take place regardless of price. Some participants aren't there to predict price direction but to hedge real world needs, these leads to what you might call non-rational traders which you don't have in stocks as generally people buying stock expect it to go up, sellers expect it to go down.


Commodities too are bought or sold to respond to real world needs rather than pure speculation / investment which makes them behave differently.


The notion of limit up and limit down in commodities would make a good stock strategy useless for them.


Some stocks are played by day traders which might make and end of day reversal as winners book profits to go home flat more likely or smaller stocks that are open to manipulation from the floor 'trying to hit stops' that is less seen in larger harder to move stocks.


This example cracks me up! Some US traders even now still see going short as unpatriotic and definitely impacts action there during wars and disasters more than it would in the UK.


Small emerging markets are moved by there lame currency than we are by move in the £.


Oil producing markets move more in line with the oil price and are probably best traded off that than there own merit.


Margin and open interest reporting and limitations in some markets impact some markets more and options expiry are much bigger deals in some markets ie gold than they are to say the FTSE.

When stocks on DJIA go ex dividend the index is repriced to take this in to account so after the dividend is paid the index and stock remain the same price. In the FTSE ex divs can knock up to 20 points a week of the index during Bank dividend season. This partly accounts for the apparent out performance of the DJIA over the years in % terms.

All these small differences give different volatility profiles in different ways in different times and give the need for different tactics at times.

It isn't fair to say that because one size doesn't fit all it isn't workable.

Stephen McCreedy

A simple trading system doesn't need to include any of the above. That is my point. This system you put forward is a simple breakout strategy but now you are introducing degrees of complexity to make it work.
 
These are not introduced in to my system at all. I am just explaining why one size won't fit all with any financial instrument and the ones that do (but on cross of 200ema) will have average returns, around the same as buy and hold t bonds coupon. Different instruments have different ATR and that would need to be looked at, before I didn't use .25% I used a 20day lag of the ATR and a fixed fraction, on the FTSE a straight .25% worked better but you might find the ATR system that takes in to account market vol. might work across more broad markets without adjustment where as the fixed .25% is FTSE specific.

My first system (and please don't get the idea I'm in love with it or think it's special!) simply states if the market goes above or below .25% from the previous close buy or sell accordingly, if it crosses back exit at that point, then exit on the close.

The second system states when the market breaches a three day high or low buy or sell, if it's above 200ema flat or long, below short or long, it works pretty well and with decent money rules might even get a good return on it with an acceptable level of drawdown.

Can't be more simple than that, it seems to work alright and if I try trading it and it does I'll carry on. If I lose 50% of what I start with I'll quit.

Donchian 120 day high and low does alright, I think around 8% but with good money management can be made to perform much better depending on what sort of draw down you'll stand.

Turtle rules are simple and easy but you might find they don't work in FX so well, this doesn't make them invalid.

Commodities tend to break in to supercycles that last decades stocks tend to go with economic cycles that might be 5-7 years with interest rate cycles, this means a good oil system might not be the best system to trade Argos shares.

I don't see where you feel I'm adding the complexity to make it work?

Anyhow please let me know your ideas if you wish and then I am off, this is getting tedious and my long stop is coming in to view on the FTSE and my DJIA puts are finally in the black!

Stephen
 
smccreedy said:
The second system states when the market breaches a three day high or low buy or sell, if it's above 200ema flat or long, below short or long.


Stephen

Hi Stephen

I visit this thread to try and improve upon what i see as a good basis, therefore my intentions are to be constructive. I hope that every other contributor to this thread can say the same.

I don't quite fully understand these entry rules. Please could you reword and expand upon them, so that even a moron can understand? ;)

Many thanks.
 
JTrader said:
Hi Stephen


I don't quite fully understand these entry rules. Please could you reword and expand upon them, so that even a moron can understand? ;)

Many thanks.

Yes because there are many morons who are interested in trading this ;)
 
Hi

The basic premise is at the end of each day the OHLC data can be entered in the s.sheet.

From this the s.sheet can tell me what the highest intraday low and high reached in the last three days was been.

That means for today's trade the levels we are looking at is 6330 and 6396.

As the system is currently long the 6330 is relevant as this is the level at which the long position will be exited, as such I place a sell stop at 6330.

Should the system be flat I would be looking to enter on the long side if 6396 was reached.

Each day new levels are given and trade only occurs if one is hit.

The system is long since buying at 6258 on 1st of the Feb the last time the market breached the 3 day high/low level.

The second side of this system is the 200 day exponential lag.

The rule states that if the market is above the 200ema we never go short. ie the system goes long at a 3 day high and exits at 3dl.

when the market is below the 200ema ( a longer bear market) the system will go short at a 3dl and cover and be flat at a 3dh.

I hope that all makes sense, as I said it's not proven and I haven't traded it but follows basic trading logic (buy strength and sell weakness) and seems quite consisten over time.

There will be bad times and it can't be relied perhaps for income as bad times can add up to months but is let to build it could do well.

I haven't got round to adding in bet sizing but with relatively low draw downs it might be possible to be quite bold.

Maybe take the distance between the two prices and risk a fixed % of your account based on that negative outcome.

Stephen McCreedy
 
This little chart explains what I mean and might make it easier to visualise the way it works.

Because the FTSE is above the 200 exp lag we are only looking to be long or flat.

Because we are already long we are only looking to exit our trade if 6,330 is reached.

Stephen McCreedy
 
third time lucky?
 

Attachments

  • illustration.GIF
    illustration.GIF
    10.9 KB · Views: 238
Tuesday's levels in pic form. Nothing has changed since yesterday, stop on long position is still placed at 6,330.

Also out of interest some stats on the performance of the system since 02/01/91 (16yrs and five or so weeks)

On the long side:

279 trades, 124 losers and 155 winners giving a 55% win ratio.

total winners were 12,063 points and losers 5,223 points giving a pay off of 2.3

On the short side:

43 trades, 26 losers and 17 winners giving a 39.5% win ratio.

total winners were 2,966 and losers 1,218 giving a pay off of 2.4


Quite encouraging results, I need to put some money controls in to be able to caluclate returns and drawdowns and then I might look to trade it and see how it goes.

It definately looks like the kind of system that will perform over years and cetainly won't make anyone rich in a short space of time.

Stephen McCreedy
 

Attachments

  • tuesday.GIF
    tuesday.GIF
    20.7 KB · Views: 225
Hi

i've been comparing the WS daily cash FTSE price, and the actual FTSE100 cash index value between 0824 - 0839 this morning.

The WS mid-price within their 2 point spread, has been between 6 - 3 points lower than the actual cash index price throughout this time.

At 0846 the cash index is 3.8 points higher than the WS mid-price.

This difference between the spreadbet quote and the actual cash index level, is the main thing that I believe could throw this strategy (0.05% - 0.25%) out of kilter. If the spreadbet mid-price was always within 1-2 points, i don't think there'd be any major frequent problems.
But when price is appraching a stop-loss or entry level, and the SB quote/mid-price is 3 or more points away from the actual cash index value, this is when orders could be triggered on occasions where the cash index doesn't trade at this level.
 
I guess some of it can be put down to time delays etc.

I'm not sure how it would affect the system overall, maybe you'd get filled sometimes when the actual FTSE wouldn't have signalled a fill.

As far as entry goes this can only be an advantage as say you are buying at 6300 the actual FTSE only goes to 6302 but you get a fill as 6300 from the s.bet co. You'd be in to a winning trade as by definition if you're filled when the FTSE didn't signal it the rest of the day is up.

On exiting getting a fill when the FTSE wouldn't signal it can only be a disadvantage as in the above example you'd be stopped out only for the market to improve for the rest of the day.

On balance I don't know if there is a reason to suggest it will overall be a good or bad thing for the system.

If I was looking to trade the .25% system seriously I'd go with CMC CFDs as they offer if done and OCO orders and you can get them much closer to the market than most s.bet companies allow.

Also at 4.45pm each night I'd set my orders for the following day. There might be times where you are in when you didn't want to be and lose but it will get you in for sure on the days when it gaps beyong the entry signal, in my experience these are the days that matter most.

Jusy my thoughts but as always having variable you can't back test brings an element of doubt in doesn't it.

Stephen McCreedy
 
smccreedy said:
I guess some of it can be put down to time delays etc.

I'm not sure how it would affect the system overall, maybe you'd get filled sometimes when the actual FTSE wouldn't have signalled a fill.

As far as entry goes this can only be an advantage as say you are buying at 6300 the actual FTSE only goes to 6302 but you get a fill as 6300 from the s.bet co. You'd be in to a winning trade as by definition if you're filled when the FTSE didn't signal it the rest of the day is up.


On exiting getting a fill when the FTSE wouldn't signal it can only be a disadvantage as in the above example you'd be stopped out only for the market to improve for the rest of the day.

On balance I don't know if there is a reason to suggest it will overall be a good or bad thing for the system.

If I was looking to trade the .25% system seriously I'd go with CMC CFDs as they offer if done and OCO orders and you can get them much closer to the market than most s.bet companies allow.

Also at 4.45pm each night I'd set my orders for the following day. There might be times where you are in when you didn't want to be and lose but it will get you in for sure on the days when it gaps beyong the entry signal, in my experience these are the days that matter most.

Jusy my thoughts but as always having variable you can't back test brings an element of doubt in doesn't it.

Stephen McCreedy

Hi

This price difference is a disadvantage, when you're stopped into trades you wouldn't want to be stopped into as the cash price never went to that price, if your SL was then hit.
It would also be disadvantageous if you're SL is hit and the cash index never retreated to your SL level.
If the long entry signal was 6315 and the short was 6285, I'd get entered into a trade at one of THESE EXACT prices, not better or worse, regardless of whether the SB's quotes were in front of, behind or level with the cash market price.


CMC SB and WS are in the process of integrating If Done orders. Both should be ready within the next few months.

CMC don't enable you to close daily bets automatically at the end of the day, you have to do this manually online or over the phone.
WS enable you to automatically close any positions at the market close. This is best if you have a job and want to forget about it, and let the trade/s manage themselves intraday.
WS do actually have OCO orders at present, although they're not clearly labelled as such.
Capital spreads have OCO and If Done orders, but like CMC do not enable trades to be settled at the market close. You have to do this manually yourself. They used to enable settlement at close, but withdrew this function. I wonder why?
 
JTrader said:
+5.1p difference at 0917. I think we should all get the picture now!


JTrader,

IMHO: If you want to properly test a strategy you need to invest in historical tick data from a reliable source for the instrument you want to trade. If you want to trade indicies then I recommend using futures data. The reason being that you can only trade a cash index via a spread betting company.

I spent time testing a breakout out system using historical tick data for the E-mini S&P500 futures. 1 tick (0.25 point) can make a difference between a good profit and a good loss.
 
new_trader said:
JTrader,

IMHO: If you want to properly test a strategy you need to invest in historical tick data from a reliable source for the instrument you want to trade. If you want to trade indicies then I recommend using futures data. The reason being that you can only trade a cash index via a spread betting company.

I spent time testing a breakout out system using historical tick data for the E-mini S&P500 futures. 1 tick (0.25 point) can make a difference between a good profit and a good loss.

OK,

is there any reason why this strategy should produce significantly different results is tested on FTSE futures data? afterall, FTSE futures has the same trading hours as the cash index.

Then if we were to trade this strategy based on FTSE futures data, we then have the problem of knowing how closely the SB quotes for daily futures SB's, follow the underlying futures market prices.
If this difference is as significant as the differences between SB cash price, and actual underlying cash index can be, using futures could be just as problematic.

Can anyone recommend a site that has free live FTSE futures prices/charts?

Many thanks.
 
JTrader said:
+5.1p difference at 0917. I think we should all get the picture now!

6.3p difference at 10:04.

This is too much of a difference IMHO, and is likely to impact upon the results, when basing trade entry decisions upon FTSE cash index data, on a fair few occssions.
Perhaps SBing just makes this type of trading strategy unworkable in reality.
 
JTrader said:
OK,

is there any reason why this strategy should produce significantly different results is tested on FTSE futures data? afterall, FTSE futures has the same trading hours as the cash index.

Then if we were to trade this strategy based on FTSE futures data, we then have the problem of knowing how closely the SB quotes for daily futures SB's, follow the underlying futures market prices.
If this difference is as significant as the differences between SB cash price, and actual underlying cash index can be, using futures could be just as problematic.

Can anyone recommend a site that has free live FTSE futures prices/charts?

Many thanks.

Let me see if I can clarify. A futures contract can be traded whereas a Cash index contract cannot be traded because there is no such thing. You need to understand (forgive me if I am being condescending) exactly what a futures contract is. In basic terms, it is a single instrument that gives exposure to the the entire underlying FTSE 100 cash index. Because it is used as a hedging vehicle it must perform in the same way as the Cash index, otherwise there is no point in using it as a hedge.

If you sign up to a broker that gives you direct access to CME Globex (Where E-mini's and many other contracts are traded electronically) then the futures quotes you get will be the same for anyone trading the E-mini through any broker. Which should be the same as the historcial tick data, which in fact it is. I purchased 2006 tickdata to check my trading and there is no difference.

I also use IG index and CMC markets SB and can say that the S&P500 Futures quotes IG Index give match the E-mini quotes I get from my Direct Access Broker, CMC are different as they quote 0.1 ticks like the big (PIT) S&P500 futures.

So what am I saying? If you are serious about trading an Index using a Mechanical strategy then you must be able to rely on both your quotes and historical data right down to the tick.
 
JTrader said:
6.3p difference at 10:04.

This is too much of a difference IMHO, and is likely to impact upon the results, when basing trade entry decisions upon FTSE cash index data, on a fair few occssions.
Perhaps SBing just makes this type of trading strategy unworkable in reality.

I agree completely.
 
JTrader said:
6.3p difference at 10:04.

This is too much of a difference IMHO, and is likely to impact upon the results, when basing trade entry decisions upon FTSE cash index data, on a fair few occssions.
Perhaps SBing just makes this type of trading strategy unworkable in reality.

10:12 am (in the spreadbet world) WS midprice trailing cash index by 4.5p. Cantor index trailing only by 0.5p.
Perhaps Cantor (or certain SB co.s) follow the index price more closely. However, the only way to find this out is to monitor it for yourself in RT.
Perhaps WS have a tendency to follow the actual cash level more closely.
Cantor don't offer OCO or If Done orders though.
 
Last edited:
Top