timsk
Legendary member
- Messages
- 8,837
- Likes
- 3,538
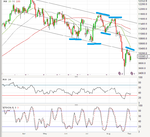
Hi Atilla,Yep 15m
I see you're a fan of RSI. You're probably already aware of it (so sorry if I'm teaching grandma to suck eggs) but, in case you're not, you might be interested in a smoothed version of the indicator called RSX. I prefer it. The 15M chart below has it on: I like a fast setting and have a 5 and 7 period overlaid on top of one another (gold and grey lines respectively). I've added the default setting of 14 periods (purple line) so you can compare it to your traditional RSI (shown in the panel below).

The indicator is quite pricey for bespoke software but, for the ever ubiquitous MT4, it's widely available on the net for free. (I don't know about the legalities.) If you're interested, I can post some blurb about its construction, along with the source file I use.
Tim.