FTSE, DAX, DOW Trading Ideas and discussions

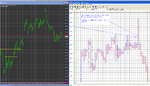
It has been observed over the past 3 corrections since 1998, the market has dropped all in July sometime by roughly 20% before continuing on to make a new high. In 2011, market corrected roughly 15 - 20% and made a new high again. S&P has only dropped roughly 9%. The key levels are 1810- 1704. If that holds, the market may go on to see another high. It has been observed over the past 3 corrections, the market has held at support and rallied to make new highs starting at the ending of September / beginning of October. Further downside to come IMHO but watch that 1704/1810.5 levels.

Chart Below

Remember this.
We're close to a bottom IMO. 1810 nearly got hit yday. S&P corrected pretty much 15% from may's ATH's. lol a rebound and we'll see another ATH - treats galore...market normally crashes 2 years after haha:LOL:
 
trend support not broken as yet
10181
10011
9863
9718
9574
9432
9293 all areas
9293-9432 is horizontal supp area aswell
not precise as large box size
9850 area broke straight after the open
We had 10181 as major res marked at 7 am this morning
Spot on...
 
9850 area broke straight after the open
We had 10181 as major res marked at 7 am this morning
Spot on...

I'd taken this screenprint before Dentist posted. It was done for my own education, reinforcing the patterns, but when D mentioned 10181, I thought I'd post it. Maybe I'm wrong with my comments on the print...
 

Attachments

  • Top and Bulltrap.PNG
    Top and Bulltrap.PNG
    124.7 KB · Views: 78
I'd taken this screenprint before Dentist posted. It was done for my own education, reinforcing the patterns, but when D mentioned 10181, I thought I'd post it. Maybe I'm wrong with my comments on the print...
Great stuff...keep up the good work
 
Good morning all :)

DAX - 4H chart showing daily PP levels.

Not much of an opinion. We are stabilising at new levels around the 10k psycho level. Considering the magnitude of drops pull back is limited. Long term still feel we have downside. Short term expecting more volatility.

PP is @ 9861 and good news is we are above it.

PP-R1 @ 10050
PP-S1 @ 9534

We have triangle forming so impending breakout to either side due sooner or later.
 

Attachments

  • DAX_4H_150826_0635.GIF
    DAX_4H_150826_0635.GIF
    19.8 KB · Views: 133
SPX - 4H chart showing daily PP levels.

Pretty much same view on SPX with some stabilisation in a narrowing triangle around the 1886 - PP level today.

PP-R1 @ 1919
PP-S1 @ 1886

Breakout of the triangle should continue in the direction of the major trend which is down imo. None of the fundamentals have changed but global issues have become considerably gloomier (avoiding doom & gloom).

Short term more volatility, Longer TF more downside imo.
 

Attachments

  • SPX_4H_150826_0650.GIF
    SPX_4H_150826_0650.GIF
    20.2 KB · Views: 140
Other stuff...

Gold has come off the 1170 highs and found support at 1130s and there is still talk of Fed rates and markets recovering. Personally, I feel we have more downside and risk so bullish on gold. Risk is on imo.

Oil has lost $40 and indicates future economic activity likely to be less demanding coupled with increase in supply. We may see $32. Don't know why just an inkling in my belly.

Always worth watching the euro wrt DAX and SPX and whilst US may be insulated to global shocks to EU and good to see it coming off the 1.17s but holding 1.1470s at the moment and further rises in the Euro may well be on the cards if the Fed rules out rate hikes. Also, Euro will rise imo due to currency devaluations elsewhere.

(y)
 
bear trap playing out..
then we it will trap the bulls
double whammy
in p/f terms ..it is a recoil in a downtrend
it will play out to a res area...unknown as yet
first rinse area starts at 10380/horizontal res/near "21" on the chart
supp is 9840 area
a decent 500 point trading range
spreadbetters get the losses back
 
Top