You are using an out of date browser. It may not display this or other websites correctly.
You should upgrade or use an alternative browser.
You should upgrade or use an alternative browser.
FTSE, DAX, DOW Trading Ideas and discussions
- Thread starter Jessi_trader
- Start date
- Watchers 114
Atilla
Legendary member
- Messages
- 21,066
- Likes
- 4,247
Long @ 11130. Expecting 11120/11100 to act as strong support.
Target 11300.
Still holding... Believe PP level will be maintained.
Dentalfloss
Legendary member
- Messages
- 63,404
- Likes
- 3,726
Spx in that supl area
lets zee if it holds
lets zee if it holds
Atilla
Legendary member
- Messages
- 21,066
- Likes
- 4,247
Spx in that supl area
lets zee if it holds
Well it's about time spx closed around that key 2070s level. Been a target of mine for gold medal for weeks. :whistling
Atilla
Legendary member
- Messages
- 21,066
- Likes
- 4,247
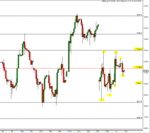
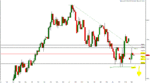
EoD charts...
DAX moving sideways and consolidating in to tighter range. I thought we'd finish above PP but as it happens we've finished 30 pips below. Weakness in markets is showing as 11300 - R1 attempt was feeble. Bulls pausing for snorts.
Still have a small long position - currently down -25. Holding out for target PP-R1 @ 11300.
Highlighted Higher Lows & Lower Highs consolidating to PP point @ 11140.
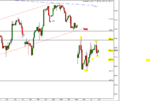
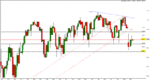
SPX pretty much same as DAX. As before set short positions below 2080s and collected towards the eod sell off. Easy money. Don't post them but the strategy is as mentioned to enter sell limit orders 4/5 pips below. There is the possibility it can fill short and bounce back up. However, upside in these markets are really limited. Downside is much greater. The moves are always up and down imo.
DOW is the chart which is looking more bearish than the other two. Going by the PP levels we got to test 2nd support PP-S2 @ 17550. Also consolidating around the PP Level @ 17730.
Market is poised for the referendum. Expectation is for it to gap up for a Yes and gap down for a No.
👍
DAX moving sideways and consolidating in to tighter range. I thought we'd finish above PP but as it happens we've finished 30 pips below. Weakness in markets is showing as 11300 - R1 attempt was feeble. Bulls pausing for snorts.
Still have a small long position - currently down -25. Holding out for target PP-R1 @ 11300.
Highlighted Higher Lows & Lower Highs consolidating to PP point @ 11140.
SPX pretty much same as DAX. As before set short positions below 2080s and collected towards the eod sell off. Easy money. Don't post them but the strategy is as mentioned to enter sell limit orders 4/5 pips below. There is the possibility it can fill short and bounce back up. However, upside in these markets are really limited. Downside is much greater. The moves are always up and down imo.
DOW is the chart which is looking more bearish than the other two. Going by the PP levels we got to test 2nd support PP-S2 @ 17550. Also consolidating around the PP Level @ 17730.
Market is poised for the referendum. Expectation is for it to gap up for a Yes and gap down for a No.
👍
Attachments
Dentalfloss
Legendary member
- Messages
- 63,404
- Likes
- 3,726
Thinking that those gaps are taken out on a yes vote
11380 as support...possible once it all settles
until the vote we flirt around 11100. To 11280 .imho
was always thinking that the market was in limbo until the result
gap starts at 11280 finishes at 11380 areas
a yes votte and we go straight into 11400!s
no vote and a stay in 11100
margins are increased by brokers..they are thinking about big gaps being closed.?lol
Last edited:
Dentalfloss
Legendary member
- Messages
- 63,404
- Likes
- 3,726
Spx gap fiĺl is 2100..next res is 2107 area
a yes vote and we should go to 2107 with 2100 as supp..imho
a yes vote and we should go to 2107 with 2100 as supp..imho
Dentalfloss
Legendary member
- Messages
- 63,404
- Likes
- 3,726
A more sinister scenario is moves up into 11520 and 2107
Bulls trapped
then a huge seĺloff...even on a yes vote
swing traders could quite easily be trapped
Bulls trapped
then a huge seĺloff...even on a yes vote
swing traders could quite easily be trapped
Last edited:
wysiwyg
Junior member
- Messages
- 41
- Likes
- 9
Morning all,
Anyone planning on holding positions over the weekend? thoughts on outcome of referendum?
Not based on any particular logic, I'm get the feeling a tight vote with overall [no] vote. So start of next week will be repeat of Monday. I won't be holding a position, as want to sleep well over the weekend 😆
MichaelJohnFX
Senior member
- Messages
- 2,891
- Likes
- 323
Lol there's hobestly no need to hold a position over the weekend tbh. Whatever way it moves you'll probavly make more money trading off that. I think they will vote no. They'd be daft to vote yes. Learnt the economics / politics behind "aid" @ university haha
MichaelJohnFX
Senior member
- Messages
- 2,891
- Likes
- 323
Anyway trend support around 11110 area. 11080 held and we got a nice bounce off that. We could get to 11288 today, and being overly ambitious maybe 11360. But that 11234 area seems more realistic.
2be
Senior member
- Messages
- 2,083
- Likes
- 370
Atilla
Legendary member
- Messages
- 21,066
- Likes
- 4,247
Sawubona guys,
Slow start today. Initial vibes are risk on scary imo. Grexit and China are the double whammies. Either way only a matter of time before we look in the mirror to see us in the same boat as China. Perhaps not as fat but another body in choppy waters.
I concur with your blogs... Expecting a Yes vote but either way high volatility and further drops after a gap up.
I was thinking of holding my DAX long as I have shorts in SPX to counter drops. Don't believe rest are immune from 2% Greece fall out as last Monday other indeces displayed same Gap Down.
Feeling a little shaky on conviction though. Will err on side of caution based on noise and vibes today going into the close.
WTI Oil is in the 56.50s and with China melt down and Iran coming on tap expect further falls.
Gold is up a little. Can't see Fed raising rates and with risk on expect it to climb furhter. See 1160s as a buy area.
Yields falling again but with risk on expecting rises. On the other hand with currency wars the only edge in a global market no appetite to raise them.
Really gooey poohey markets right now.
Overall reaction is to strap my self in - and sell-it all 👎
Charts to follow soon 👍
Dentalfloss
Legendary member
- Messages
- 63,404
- Likes
- 3,726
30 min data since 30th june

25 points by 3 reversal
close plot
from these chart inputs we
11200 trend res/red
11125 breakdown/pink
breakout 11100/aqua
trend supp 11050/green
gives us a general feel for the day
trend is up with a downward recoil/minor trend
thats it
goin either way..imho
25 points by 3 reversal
close plot
from these chart inputs we
11200 trend res/red
11125 breakdown/pink
breakout 11100/aqua
trend supp 11050/green
gives us a general feel for the day
trend is up with a downward recoil/minor trend
thats it
goin either way..imho
Dentalfloss
Legendary member
- Messages
- 63,404
- Likes
- 3,726
dcent rally from the 2073 area we had marked as supp
2e070 was the low
the good bit was it hovered round for some time before it popped
2e070 was the low
the good bit was it hovered round for some time before it popped
Dentalfloss
Legendary member
- Messages
- 63,404
- Likes
- 3,726
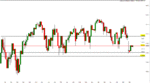
updated spx chart from yesterday
support held
aqua horizontal column of "O"s
trend is up...still

support held
aqua horizontal column of "O"s
trend is up...still
Atilla
Legendary member
- Messages
- 21,066
- Likes
- 4,247
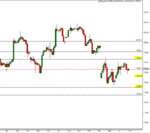
My charts and PP levels for today...
DAX, SPX & DOW
Expecting PP Level to hold and perhaps will trade on the lower support sides today.
Will be looking out for Lower Lows and Higher Higs & LH and HL etc...
DAX, SPX & DOW
Expecting PP Level to hold and perhaps will trade on the lower support sides today.
Will be looking out for Lower Lows and Higher Higs & LH and HL etc...
Attachments
wysiwyg
Junior member
- Messages
- 41
- Likes
- 9
Really gooey poohey markets right now.
I'm relatively new to trading, so my opinion could be rubbish, but I agree risk is still on, the headwinds keep getting stronger but the markets are in denial. To me it's been that way since 09, but I suppose QE, low interest rates, and no returns elsewhere meant money had to go somewhere. The world is sinking in debt, everyone is trying to devalue their currencies, and America is going to raise rates?!
As for Greece, it's like watching a car crash in slow motion, even if a deal is made next week, it's just prolonging the inevitable. Who knows what the catalyst will be to turn these markets and when.
For now I just keep learning and your posts help, so thanks all
Dentalfloss
Legendary member
- Messages
- 63,404
- Likes
- 3,726
well....
how do we know which chart inputs are right ??
we dont...thats why i refer to "areas"-
so we change inputs regularly as volatility changes during trends and during the day
you must have nimble fingers
so from the chart we can see that 11050 supp was spot on..it is slightly luck because i had 5 charts open with different settings and was looking for signals in a few areas..it turned out that 11050 area gave a breakout signal on the tick chart
Similar threads
- Replies
- 4
- Views
- 2K