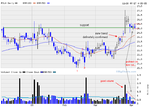
ddunne82 said:My interpretation of the CTSH chart would be as follows:
1) The reversal candle's volume was less than the previous candles which would make me slightly nervous about taking the trade and would thus wait for the next candle to confirm the reversal (higher close on higher volume - a nice lower wick wouldn't go amiss either)
2) MACD recently crossed to the negative side so again lengthening your odds of success
3) Price made a higher high but CCI has negative divergence (could also argue RSI also displays this) - i would further argue that this divergence is quite strong because it has happened over 3 peaks
I'm sure everyone is going to see/interpret different things in the chart but what better way to learn than to throw your ideas out there!
David
would have to agree with ddunne and eddy jo here - macd is a problem - would wait a day or so for more positive signal . Of course one could put on an anticipatory small long here - but as yet no clear signal from macd that this is going in right direction - so ita case of hold horses !

