Hi,
I’ve just received a private message here on t2w from a fellow trader, who was asking me to write something about the relationship of cot data and currencies.
Well first of all,
CFTC publishes COT reports on many currency futures, so the basic relationship is this; you can have a look at major market participant’s positions on these markets as well. Of course one might ask, “who are the Commercials here?” Actually they are companies, who do business internationally and require the usage of different currencies than the ones they are using at home, so they are exposed to currency risks.
Does COT analysis work on currencies? My answer is: YES
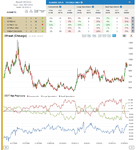
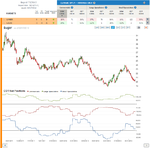
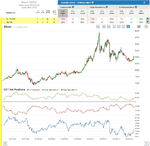
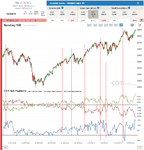
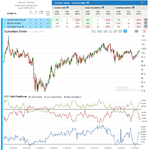
Let me show you a chart on AUD. I have indicated some places on the chart, where a turn in price direction coincides with some sort of extreme in the COT.
Of course if you would like to trade a pair, where both currencies have futures and COT reports on them, you need to analyze both of those markets’ COT report and come to conclusion, since we don’t have COT report on currency pairs.
A little analysis on currencies for you this week:
AUD
A COT Extreme Sell signal in the report --> COT Index: C - 12%, LS - 91%, SS – 65%. Prices have already started to decline, the recent top is not far if you were searching for resistance levels for your stop.
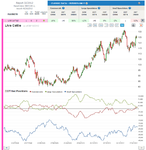
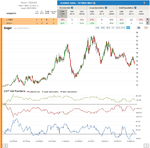
GBP
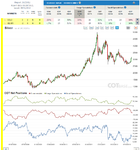
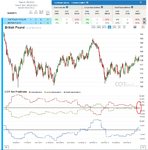
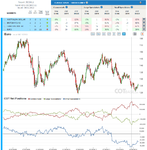
We have no COT Extreme in the market. What is interesting though is that last week only SS thought prices could go higher, C and LS both cut back on their net long positions (look at the 1 yr chart, I have indicated it).
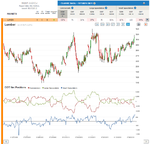
CAD
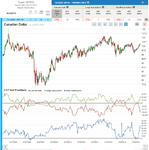
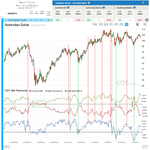
The extreme here is not as big as in AUD, but still large --> COT Index: C - 22%, LS - 84%, SS – 62%. The question is, would this extreme in the COT widen more or is this a relative top in prices. If the next COT report shows us that participants are moving away from their extreme territories, I guess that would confirm the top. One thing is for sure: base on COT analysis, the picture now is more bearish than bullish.
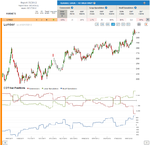
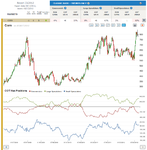
EUR
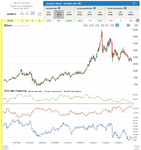
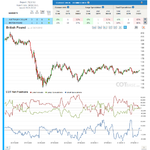
There was an All-Time COT extreme buy signal not long ago (indicated on chart), but could not push prices higher. Since then, C,LS and SS have moved away from their extremes. The fact that LS are in a buying mood (cutting back on their net short positions) is a bullish signal, on the other hand if this direction in COT would start to change and we would be witnessing another move towards extreme territories, I would be expecting prices to decline some more and I would be looking for buying opportunities, when we have reached these extreme levels, I would say, C at net long >250 000 contracts, LS < 200 000 contracts and SS <40 000 contracts.
JPY, CHF
Nothing special, we don’t really have any COT signals now.
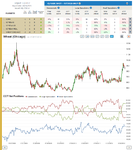
MXP
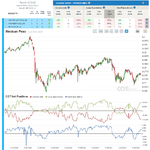
Similarly large COT extreme as in CAD --> COT Index: C - 23%, LS - 77%, SS – 67%.
The picture is bearish.
All the best,
Dunstan

