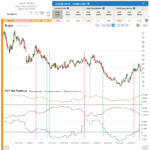
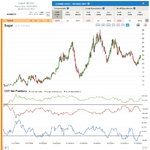
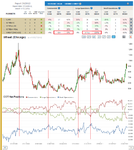
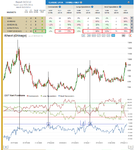
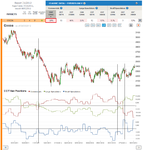
The first market that was mentioned in this review (see my previous post for the video) was the sugar market. I think it is a great example for those of you, who would like to understand how to use the COT change indicator, what does a specific change size mean.
The sugar market’s 20% change (on a 52-week range)in Commercials positions illustrates well that a 20% change may be considered large in one market, while in another market it happens pretty often, so it might be negligible there. You have to go back in time and see if that change size is really significant or not.
If you look at the 1 year chart below, you will find that similar or even larger changes have happened in the past and not that rarely. Now does this mean that this 20% change will not have any effect on the price? Well I’m sorry to say this, but you have to do your homework, do a little historical analysis. I have indicated on the 1 year chart those situations when there were similar changes. I would say that roughly 70% of the time, such a change size had an effect on prices. Ok, now you might ask, whether this time it would have an effect or not. My answer to this question is: I don’t know. It’s all about chances… I think – looking at the chart – that this change size could move prices lower in the near term, but if you have a look at the 5 year chart, you can see that we are not at an extreme COT level for neither market participant, which makes it more difficult to predict a direction.
Besides understanding to read COT signals and see what effect they might have on prices, I think it is also very important to know when to step aside from a market.
I’m not saying that Sugar does not have opportunities, but I think one should always consider the risk/reward of the trade and search for those few markets where this ratio is more favorable.
I’m personally looking for those situations when the picture is very clear, and you don’t need to do much thinking 🙂
All the best,
Dunstan
New to COT? Read my first couple of posts in this thread or check out this video for more info

