Fibonacci-Trader Discussion Board

I have always use candles or OHLC, candles in particular contain a lot of arcane knowledge; they are Japanese in origin I hink, and very inscrutable (g), there is a whole symbology to them.

MT


zeeta said:
As a newbie and having an interest in using fibs, can someone suggest which graph type to use for eod tra :confused: ding in fib analysis. Should it be closing price or candles?
 
jimbo57 said:
I was merely pointing out that ealier in this thread I asked what gnomonic expansion was and am still awaiting an answer. As a mathematician it interest me. Whether or not there is any need for that is an entirely different question.
http://mathworld.wolfram.com/GnomonicNumber.html
 
How do you know that a retracement has finished retracing ?

Suppose the Dow is in a down trend.
Its last peak was at 11,000.
It had fallen to 10,000. ( a fall of 1000 points ).
It has started to retrace.
The retracements would be:
38% = 10,380 ( thanks a320 )
50% = 10,500
68% = 10,680 etc

Suppose the Dow has actually reached 10,380 !!
What is the decision-making process to say:
a) the retracement is still valid, and it could go to 50% or higher
b) the retracement has completed, and it has now resumed the down trend.

Any takers ?

PS: That gnomic stuff is really meta-physical: Kabbalah, Tree of Life, etc.
 
How do you know that a retracement has finished retracing ?

no'one 'knows' but an educated guess can be made by reading price action (something youll have to learn for yourself by the way). IMHO fib retracement should be viewed as possible areas where support or resistance may be seen and nothing more. Blind buying/selling fibs will end in failure 9 times out of ten as pitbull (i think) suggested.

good luck
regards
dt
 
jimbo57 said:
The reason that TAs "work" is surely that there is a core group (high volume) in a particular market that look at certain indicators habitually. Knowing what these guys look at is half the battle.
Or just maybe these high volume types know what us lot are looking at....
 
Did someone say Kabbalah?

MT


trendie said:
How do you know that a retracement has finished retracing ?

Suppose the Dow is in a down trend.
Its last peak was at 11,000.
It had fallen to 10,000. ( a fall of 1000 points ).
It has started to retrace.
The retracements would be:
38% = 10,380 ( thanks a320 )
50% = 10,500
68% = 10,680 etc

Suppose the Dow has actually reached 10,380 !!
What is the decision-making process to say:
a) the retracement is still valid, and it could go to 50% or higher
b) the retracement has completed, and it has now resumed the down trend.

Any takers ?

PS: That gnomic stuff is really meta-physical: Kabbalah, Tree of Life, etc.
 
I absolutely agree, fibs are very useful guides as to extent and possible turning points, and can be used as confirmations in combination with other trading signals. No one technique is the whole story, and I am learning quite quickly that you need several factors to combine before entering a trade if ou want to minimise the risk (and of course, you *do* want to minimise the risk I am sure!).

It is worth saying (at least I *think* it is worth saying) that IMHO, the benefit of using fibs is partly because these ratios and numbers are built into nature and therefore recur in natural events and cycles, but mainly because they are used by a lot of people, and the price predictions that they indicate may well be partly self-fulfilling. They are if you like, an insight into the psychology of the market, by which I mean the psychology of the traders.

Shoot me down in flames if you think this is an erroneous or overly simplistic view.

MT

darktone said:
no'one 'knows' but an educated guess can be made by reading price action (something youll have to learn for yourself by the way). IMHO fib retracement should be viewed as possible areas where support or resistance may be seen and nothing more. Blind buying/selling fibs will end in failure 9 times out of ten as pitbull (i think) suggested.


good luck
regards
dt
 
MT,

re: Kabbalah;

I thought the Tree of Life was related to the Kabbalah, and jewish mysticism.
Apologies if wrong.
 
Not at all, you are quite right. I was just surprised to see it mentioned here. The Mystical bit of MysticalTrader is there for a reason <g>

MT


trendie said:
MT,

re: Kabbalah;

I thought the Tree of Life was related to the Kabbalah, and jewish mysticism.
Apologies if wrong.
 
50% Retracement

trendie said:
Fibonacci Numbers:

I wont go into the history of who he was etc, as this info can be gleaned elsewhere. Nor will I go into the ubiquity of the Golden Mean.

The numbers are derived by taking the numbers 0 and 1, and then adding the latest two numbers to derive the next number.

For example, 0 + 1 = 1. ( the sequence is now 0, 1, 1 )

Now add the last two numbers, 1 + 1 = 2. ( the sequence is now 0, 1, 1, 2 )
Now add the last two numbers again, 1 + 2 = 3. ( the seq is now 0,1,1,2,3 )
One more time !! ( 2 + 3 = 5 ) this gives, 0,1,1,2,3,5.

This can go on indefinitely. Since T2W doesn’t possess that amount of web-storage, the next few numbers are:
0, 1, 1, 2, 3, 5, 8, 13, 21, 34, 55, 89 etc

Now, if you divide each consecutive number, the further along the sequence you are, the result tends to the famous Golden Mean, which is about 1.618, and its complement, 0.618.

For example, 2 / 3 = 0.667. 3 / 2 = 1.5.
For example, 3 / 5 = 0.6. 5 / 3 = 1.667.
For example, 21 / 34 = 0.6176. 34 / 21 = 1.619.

As you can see, the further up the sequence, the closer the results are to these 2 numbers.

The square root of 1.618 is 1.272.
The square root of 0.618 is 0.786.

So as I don’t get carried away, I am not going to use the 38% figure.
( it is derived by squaring 0.618. ( 0.618 * 0.618 = 0.3819 )

The main reason for this, is to start with the basics, and build on these basics.

If contributors feel strongly about some retracements, and can make a good case, then we should adopt them. Otherwise, it is best to prove the basics, before adding more lines.

I am concerned that if we throw enough lines onto a chart, we can prove anything !!

So, to start with, I suggest the following 4 percentages are of note:
62% ( rounded from 0.618 )
79% ( rounded from 0.786 )
127% ( rounded from 1.272 )
162% ( rounded from 1.618 )

I will take advice from the readers as to whether 50% retracement is valid.
( actually, it probably is, but can the 50% retracement be derived in the context of Fibonacci ? )

This is my understanding of Fibonacci numbers.

I propose the above as a starting place for further analysis.

In the context of trading, markets appear to change direction, or make retracements on these particular percentages. Perhaps more often than other percentages.

If the above is a satisfactory basis, I propose to see how all this can be applied to the markets.
( hopefully there will be contributors with experience of stocks, as my trading vehicles tend to be indices, DOW, SP500, DAX etc )

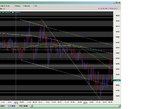
IMHO I believe that 50% Retracement is valid as it is 1/2 (the 3rd and 4th numbers in the Fib summation (0, 1, 1, 2). Also, I think you should also include 38% as that is also an important percentage within the Fig Summation series.
 
this is nice

See the attached jpg file. Notice how the spike stops right at the 61.8% retracement level, cannot sustain it and collapses back down.

Pity I couldnt predict it!

MT


Attachments

  • GBP USD 150704.jpg
    GBP USD 150704.jpg
    100.5 KB · Views: 411
MysticalTrader said:
I have always use candles or OHLC, candles in particular contain a lot of arcane knowledge; they are Japanese in origin I hink, and very inscrutable (g), there is a whole symbology to them.

MT

The full name of candlesticks is indeed Japanese Candlesticks and they have been used for hundreds of years - well before the markets came into existance. :D
 
darktone said:
no'one 'knows' but an educated guess can be made by reading price action (something youll have to learn for yourself by the way). IMHO fib retracement should be viewed as possible areas where support or resistance may be seen and nothing more. Blind buying/selling fibs will end in failure 9 times out of ten as pitbull (i think) suggested.

good luck
regards
dt

darktone is quite correct - you should not use Retracements as a predictor but instead as a confirmation (a lagging indictor if you like). There are other Fib techniques that can be used as predictors - Fibonacci time goal analysis is one of them. So if the share price breaks down through the 38% Retracement mark don't automatically buy/sell because the share price could carry on dropping and go through the 50%, 62% or even 100% Retracements (yes 100% is a valid Fibonacci Retracement - 1/1). Wait for the price to rebound back through the Retracement line. However, this should not be used on its own. The more Fib indicators that all point to the same thing the better, e.g. if an important Retracement level forms at the same point as a Time Goal (and/or a PHI-channel is crossed) the stronger the signal.

If anyone whats to read a very good book about using Fibonacci numbers for trading consider buying "The New Fibonacci Trader: Tools and Strategies for Trading Success " by Robert Fischer (you even get some free software that draws all the Fib indicators for you).
 
Hi JungelJim,

Do you know of any good websites that give a synopsis of Fib Time Analysis ?

Google keeps throwing up the book you describe - which is fine - buy I want an e-book first !
Or I get a once in a lifetime "was $250, but for YOU, $47" type stuff.

I am curious of the principles of Time Analysis.

thanks
 
Top