Euro Daily Trader

thanks for that information.

I suppose it is important to remember there may have been occasions in that history June through to middle of September when there were Friday night trades with results that would not have been the same with the new auto closure........ not just that session where it ran to over 100 pips profit.

That is correct Wiseambitions.

On our tests, the change we made to the EA when introducing the Friday EarlyCloseOffset actually reduced the annual profit by 9%. This could be substantial, but we had to balance it off with the risk of wiping out an account, which would be a disaster.

Mike
The Forex Club
Hello Mike

Out of the Fridays between 1 June and the amendment to the EA, do you happen to know which ones might have achieved a different result than the actual history?
I'd like to update my analysis accordingly, and probably best I then email you my findings privately.
 
Hello Mike

Out of the Fridays between 1 June and the amendment to the EA, do you happen to know which ones might have achieved a different result than the actual history?
I'd like to update my analysis accordingly, and probably best I then email you my findings privately.

We don't have that info Wise. The direction of the trades taken each day is in the results so I suppose if one scrolled back and looked at each of the Friday trades it could be worked out. I don't think you will find a great difference in that short period.

That said, we would not want to change the EA whatever the result. As I said, the Friday Early Close function was introduced to protect against wiping out an account, it was not a profit/loss consideration.

Mike
The Forex Club

OK I'll try and work it out the long way....... 9pc loss of profits per annum (presumably assuming the system compounded at 2% risk per trade) is an insignificant reduction, a small price to pay, for the sake of avoiding bad weekend gaps.
 
And nice to have the pleasure of a win this time, Tuesday


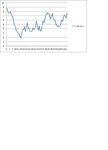
I'm attaching a graph of cumulative pips since 1 June from the developers' figures, however I have amended the gain on a trade which ran over one weekend and could have achieved over 100 pips: I called the win 39 on that occasion, the Friday night forced closure is now part of the revised strategy and is known to affect results
 

Attachments

  • edt cumulative pips since 1 jun 2011.JPG
    edt cumulative pips since 1 jun 2011.JPG
    26.5 KB · Views: 167
Last edited:
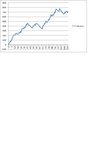
This chart shows the average daily production of pips for the last 50 days (10 weeks of 5 trading days) by EDT up to 8 November on a rolling basis. I think this is a meaningful way of plotting a system's progress

And in spite of what it does to your nerves when you go through a bad patch (and these figures obviously include August and October when there were 6 or more losing trades in a row), a rolling average of 5 6 or 7 pips per trade should be considered acceptable progress at that


PS. After the 9th November session (TP) the 50 day MA was sustained at the same level (the 51st trade falling out of the data set was also a win)
 

Attachments

  • MA of pips per day EDT last 50days to 8 November.JPG
    MA of pips per day EDT last 50days to 8 November.JPG
    26.1 KB · Views: 185
Last edited:
This chart shows the average daily production of pips for the last 50 days (10 weeks of 5 trading days) by EDT up to 8 November on a rolling basis. I think this is a meaningful way of plotting a system's progress

And in spite of what it does to your nerves when you go through a bad patch (and these figures obviously include August and October when there were 6 or more losing trades in a row), a rolling average of 5 6 or 7 pips per trade should be considered acceptable progress at that


PS. After the 9th November session (TP) the 50 day MA was sustained at the same level (the 51st trade falling out of the data set was also a win)

That's excellent stuff Wise. We shall be following your charts with interest.

With the winning trade yesterday (9th Nov) we are just 12 pips short of getting back to the high that was achieved 3 weeks ago on 17th October. That run of 6 losses was unfortunate but as you can see, it quickly comes back as only 3 wins are necessary to balance that off.

Whatever happens Thursday and Friday, this will be a profitable week as we only need 2 wins in any week to be assured of making a profit and EDT did that Tuesday and Wednesday.

Mike
The Forex Club
 
Friday PM
I doubt the system will trade today, the markets have raced away since the NY session opened, mainly on news about Italy, whether it's a sustained recovery I would not wish to say.

Assuming no trade, result for the last 50 days (my observations) is +325 pips.
Wish it would carry on in that vein

By way of comparison, FMT has lost nearly that many pips in the same 10 weeks
 
Tuesday afternoon/evening's EDT trade bobbed around for 6 and a bit hours and ended with TP after midnight GMT. I think that's the longest session I've had with the system in normal circumstances. I felt the system had chosen the right direction to trade but it was after a day of steady decline, and after a few minutes nothing more seemed to happen to exchange rates, and it looked like that proverbial coin flip, but ended pleasantly.

The 50 day MA still runs at around 6.5 which is actually better than the 100 day MA which is a little under 5.0. Much of this difference (100day MA not being so good as the 50) relates to August also being a less successful month, eg the 3 month MA which includes second half August is between 4.5 and 5.0. Still a steady positive production all the same.

Hey is anyone reading or am I talking to myself?

All I'll say is I hate the pain of 5 or 6 SLs in a row (2nd half October) but the system does pull itself out of trouble fast with the low Risk : Reward Ratio, and if it carried on at this rate I think it is far better than most people admit.
 
Last edited:
Hey Wise, I'll come and keep you company.... I've been following this a while now and I think it's time to make the leap of faith and commit to buying this EA and putting it on a live account. Been mulling and over analysing and on balance I think the positives outweigh the negatives. The 2:1 payout ratio set up minimises and reduces the 'risk of ruin'. As to why you're lonely here, I think there's a bigger thread running on Donna Forex - The Forex Club (theforexclub.eu) though I prefer the less noisy and more meaningful thread here....
 
Hi wiseambitions,

I am following your statistics with interest!
Thanks for writing and sharing that.

Cheers
 
Hi wiseambitions,

I am following your statistics with interest!
Thanks for writing and sharing that.

Cheers

Nice to hear from all you guys again.....so I wasn't on my own that's good.....


Rolling averages:

Last 25 days +29 (not great but still+ve)
Last 50 +325
Last 75 +398
Last 100 +494
Days include sessions with no trade signal generated. Therefore 50 means 10 weeks of Monday to Friday


Please let's hope the system keeps producing at least 5 pips on average every time, compensating for the losses with hopefully above 40 pc of trades being winners


I don't belong to the Donna Forex thread, but think there's nothing wrong with trying to overcome so much of the negativity which goes around as one or two on there have been extra bitter, understandably, but unfairly, and if they would only look at the bigger picture, which is what the above figures attempt to show

illegitimi non carborundum
 
Last edited:
Thursday.

What happened? My system went long, and anybody with half a bit of gumption would have said it should have been a short trade.

SL in 4 minutes. Not nice
 
I am seeing that the EA seems to fail on Thursday's and Friday's. So far, I have not seen a win on any Thursday or Friday since I purchased the EA 6 weeks ago. There was one Friday when the official site showed a win because they used the early close option but unfortunately I did not have this set.

The good news is that based on my analysis, I reduced my risk today from 3% to 1%..... Attached is a copy of my results so far... I am considering only trading on Monday's or potientially Monday and Wednesday.
 

Attachments

  • EDT.png
    EDT.png
    28.8 KB · Views: 157
Last edited:
I am seeing that the EA seems to fail on Thursday's and Friday's. So far, I have not seen a win on any Thursday or Friday since I purchased the EA 6 weeks ago. There was one Friday when the official site showed a win because they used the early close option but unfortunately I did not have this set.

The good news is that based on my analysis, I reduced my risk today from 3% to 1%..... Attached is a copy of my results so far... I am considering only trading on Monday's or potientially Monday and Wednesday.


My quick analysis of results, by day of week, since 1 June:

Monday 137
Tuesday 134
Wednesday 310
Thursday 57
Friday 102

E&OE
 
My quick analysis of results, by day of week, since 1 June:

Monday 137
Tuesday 134
Wednesday 310
Thursday 57
Friday 102

E&OE

Thanks for the analysis.. I too was trying to enter the data from the graphics on the web site and analyze it. I don't have the data back to June so I just ran the analysis from August. It clearly shows that Wednesday is the best day to trade this strategy. I may do a longer term analysis but I always struggle back testing systems that are time-of-daysensitive because I don't know how to handle the history data (what time zone is the data and how is day light savings addressed in the data).

For now, I think I will really lower the risk on Monday and Tuesday, raise the risk on Wednesday and not trade on Thursday or Friday.
 
Last edited:
Thanks for the analysis.. I too was trying to enter the data from the graphics on the web site and analyze it. I don't have the data back to June so I just ran the analysis from August. It clearly shows that Wednesday is the best day to trade this strategy. I may do a longer term analysis but I always struggle back testing systems that are time-of-daysensitive because I don't know how to handle the history data (what time zone is the data and how is day light savings addressed in the data).

For now, I think I will really lower the risk on Monday and Tuesday, raise the risk on Wednesday and not trade on Thursday or Friday.

I too would be interested in this analysis guys but just don't have the time, so let's see if I can help out. Attached is our backtest for 2010. Let's see if that 12 months comes up with the same anomaly.

Mike
The Forex Club
 

Attachments

  • 2010 - 2% Compound.htm
    283.1 KB · Views: 260
  • 2010 - 2% Compound.gif
    2010 - 2% Compound.gif
    8.4 KB · Views: 168
I would love to have the time and inclination to look at the backtests, remembering of course that past performance is no indication of the future

On a slightly different angle, we've had a few days in the doldrums. What this does to the measurements is make the 50day MA come to +5.26, which I think Mike would say is in line with expectations, however the 25day MA has fallen to -1.26. We badly need a couple wins from the method to nudge this one back to normal, which again would be a daily average in region of 5 or more. It is painful watching a trade go to 25 and more pips of profit then fall right back to BE which is what happened twice in a row

PS TUESDAY: Unfortunately trade was another loser, and it has dragged down the MAs a bit.
 
Last edited:
I too would be interested in this analysis guys but just don't have the time, so let's see if I can help out. Attached is our backtest for 2010. Let's see if that 12 months comes up with the same anomaly.

Mike
The Forex Club

Attached is the data in an Excel workbook with my simple analysis. It would appear very different from my original analysis. When looking at 2010 Fridays are the best day to trade.. And the variation from month to month and quarter to quarter seem to say that there is no correlation to the day of the week.

I don't know how much longer I can hold on to this. After more BE's and losses I am beginning to think that the market has changed and the system no longer works. It would appear that August was a bad month, October was a bad month, and we are more than half way through Nov and another bad month.

Is anyone going to let this trade on Wednesday, Thursday, and Friday this week given the US holidays?
 

Attachments

  • 2010 back test.xls
    136.5 KB · Views: 172
Top