JahDave
Experienced member
- Messages
- 1,563
- Likes
- 28
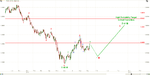
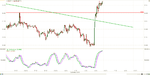
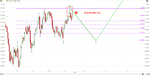
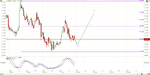
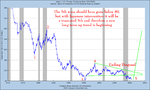
This should get the USD moving up..........
TOKYO (Dow Jones)--The Japanese government said Friday it will intervene in the foreign exchange market if needed to curb a rise in the yen that it warns could disrupt the economy and financial conditions.
"A rapid or prolonged strengthening in the yen is a problem that cannot be overlooked, given its negative impact on the stability of the economy and financial conditions," the government said in a statement accompanying an announcement of a Y915 billion stimulus package to support the economy.
"The government will take decisive steps, including interventions, when necessary," the government said.
The government also kept the heat on the Bank of Japan to do more to stop consumer price deflation, which has ravaged Japan's economy on and off for years, hindering any sustainable recovery.
The government said it will keep in close contact with the central bank with the aim of conquering deflation, adding that it expects "appropriate and flexible" monetary policy management to support Japan's economy.
-By Juro Osawa, Dow Jones Newswires; +81-3-6269-2794; [email protected]
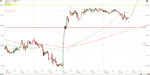
I wasn't sure if the announcement the other day would get the yen moving in the right direction or not, but Japanese government didn't wait to find out. Now that the US session is on, I'm expecting a pullback today before the Dollar starts heading up again. I suspect that if the pullback today is really large the Japanese may buy dollars again tonight.