You are using an out of date browser. It may not display this or other websites correctly.
You should upgrade or use an alternative browser.
You should upgrade or use an alternative browser.
JahDave
Experienced member
- Messages
- 1,563
- Likes
- 28
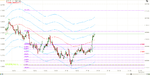
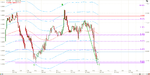
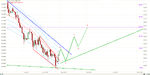
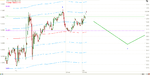
EUR_USD update. This is the pair that I work the hardest on and try to keep the most pure from an Elliott Wave standard because of the name of my thread. You can see from my hour chart that I think this pair is about to finish a double three. That is an ABCXABC. The current Elliott Wave prevailing labeling is an abc that equals x and then an abc that equals y, so this would be called an x,y wave. I like the old school way myself and both ways are technically correct. Anyway, this pair should make a small push up and then make a tradeable move down to the 1.2625 area before making another large run up. This last run up, whenever it starts should be quite sizeable and tradeable itself. Now here is the tricky part..........After this last run up then this pair should begin a C wave down on the Grand Supercycle degree. Now I have the 1.35 to the 1.40 area to be the top on the run up. The drop after that should at least go to parity and maybe even below that.
Good trading everyone,
JahDave
Good trading everyone,
JahDave
Attachments
JahDave
Experienced member
- Messages
- 1,563
- Likes
- 28
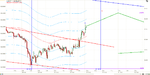
AUD_USD update. I suspect the 161% fib level which is the .9008 should be some good resistance for this pair and create a drop on Sunday night.
If I am wrong on this one then it is probably going to the .9152.... and then going for a large correction.
Attachments
4xpipcounter
Experienced member
- Messages
- 1,571
- Likes
- 30
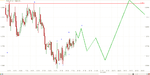
I'm in the middle of my WR right now. Your forecast matches my circa area of the highest probability that the USD/JPY will rise to before another drop.
Here's my forecast for the yen. If I would have been home with these charts instead of at work trying to hurry without as good as these charts I would have stayed in long, but I still made some good pips at work.
JahDave
Experienced member
- Messages
- 1,563
- Likes
- 28
EUR_USD update. This is the pair that I work the hardest on and try to keep the most pure from an Elliott Wave standard because of the name of my thread. You can see from my hour chart that I think this pair is about to finish a double three. That is an ABCXABC. The current Elliott Wave prevailing labeling is an abc that equals x and then an abc that equals y, so this would be called an x,y wave. I like the old school way myself and both ways are technically correct. Anyway, this pair should make a small push up and then make a tradeable move down to the 1.2625 area before making another large run up. This last run up, whenever it starts should be quite sizeable and tradeable itself. Now here is the tricky part..........After this last run up then this pair should begin a C wave down on the Grand Supercycle degree. Now I have the 1.35 to the 1.40 area to be the top on the run up. The drop after that should at least go to parity and maybe even below that.
Good trading everyone,
JahDave
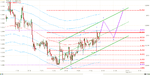
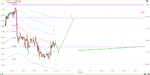
Hopefully this is a clearer and easier to understand hour chart. I have labeled a corrective sequence ABCX,ABCX? The question mark is because I'm not sure if this X wave is over yet and then one more ABC. This is my preferred count at the moment. (A quick note on preferred counts. impulse waves are much easier to count than corrective waves because there are more possible wave patterns in corrective wave formations.) This will be a triple three and Elliott Wave patterns can only be single, doubles or triples, so when this last move up is over then there will be a very tradeable move down.
Attachments
Last edited:
JahDave
Experienced member
- Messages
- 1,563
- Likes
- 28
Hopefully this is a clearer and easier to understand hour chart. I have labeled a corrective sequence ABCX,ABCX? The question mark is because I'm not sure if this X wave is over yet and then one more ABC. This is my preferred count at the moment. (A quick note on preferred counts. impulse waves are much easier to count than corrective waves because there are more possible wave patterns in corrective wave formations.) This will be a triple three and Elliott Wave patterns can only be single, doubles or triples, so when this last move up is over then there will be a very tradeable move down.
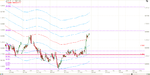
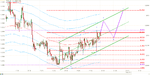
Here's a quick follow up chart as to why I questioned that second x wave. I thought it move down in an ABC and now it looks like it is doing that. After this move down this pair should have a nice move up and any time now would be a good time to go long. In fact I don't have this pair traded at the moment and as soon as I post this I am going to buy it.
Attachments
JahDave
Experienced member
- Messages
- 1,563
- Likes
- 28
JPY update. This pair is chomping at the bit to go up. It's just a matter of a short time before it begins.
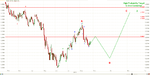
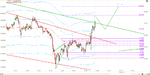
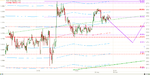
USD_JPY update. It looks like we may have a long term bottom in place or at least a medium term bottom in place. But don't get too excited yet because after this pair finishes wave 5 up then it should have a deep retracement for wave 2 on the next larger scale. The bottom of wave 2 is almost always the best time to enter the trade in the opposite direction. I will be watching for a good spot to buy based on wave counts and fib levels.
Attachments
JahDave
Experienced member
- Messages
- 1,563
- Likes
- 28
USD_JPY update. It looks like we may have a long term bottom in place or at least a medium term bottom in place. But don't get too excited yet because after this pair finishes wave 5 up then it should have a deep retracement for wave 2 on the next larger scale. The bottom of wave 2 is almost always the best time to enter the trade in the opposite direction. I will be watching for a good spot to buy based on wave counts and fib levels.
I can certainly see this scenario playing out on the daily charts. So that means around the 84.70 area will be the spot to get in long.
Attachments

JahDave
Experienced member
- Messages
- 1,563
- Likes
- 28
Here's a quick follow up chart as to why I questioned that second x wave. I thought it move down in an ABC and now it looks like it is doing that. After this move down this pair should have a nice move up and any time now would be a good time to go long. In fact I don't have this pair traded at the moment and as soon as I post this I am going to buy it.
Here is the 5 minute chart to follow up. I did take that long after I posted my last comment and already cashed it out for 10 pips. Anyway I went back short and am looking for this pair to bottom out at 1.2715. Then I will get back in long, but for now I am short.
Attachments
JahDave
Experienced member
- Messages
- 1,563
- Likes
- 28
The Dow futures are up 173 points at the moment, so expect risk trades to go up for a while.
In 2 hours and 30 minutes since the Forex market opened then the Dow futures have gone from 173 points up to 17 points up currently. I guess the Forex market didn't play nice tonight with the stock market.
JahDave
Experienced member
- Messages
- 1,563
- Likes
- 28
In 2 hours and 30 minutes since the Forex market opened then the Dow futures have gone from 173 points up to 17 points up currently. I guess the Forex market didn't play nice tonight with the stock market.
But don't take this the wrong way, because I still expect the stock market futures to go back up tonight and the risk trades to start back up in about 4 or 5 hours from now.
JahDave
Experienced member
- Messages
- 1,563
- Likes
- 28
I just sold USD_JPY for a short term scalp trade. It's a risky trade but I'm only looking for 20 pips.
Actually I'll be looking for 50 0r 60 pips.
JahDave
Experienced member
- Messages
- 1,563
- Likes
- 28
Time to short the USD_CHF. It is ready to go down
Here is my 5 minute chart and it it ready to go down.
Attachments
JahDave
Experienced member
- Messages
- 1,563
- Likes
- 28
Here is the 5 minute chart to follow up. I did take that long after I posted my last comment and already cashed it out for 10 pips. Anyway I went back short and am looking for this pair to bottom out at 1.2715. Then I will get back in long, but for now I am short.
As usual I always do things a bit early, so I just closed my short Euro for 12 pips. I know it will probably go down some more but I had a sure thing on a 5X normal position and it was very appealing.