You are using an out of date browser. It may not display this or other websites correctly.
You should upgrade or use an alternative browser.
You should upgrade or use an alternative browser.
CM, been thinking abt this a bit : 3 PD - this only seems to happen in the later part of the day, ie if one wants to go long on that - in the earlier part of the day, like today, seems a fairly safe bet to just wait for 2 PD and long - after a nice drop of course.
tradesmart
Experienced member
- Messages
- 1,286
- Likes
- 22
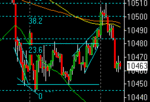
Is this a rare 'beer mug and handle' sighting (a bit like a cup and handle setup, but for those who prefer something stronger than tea! :cheesy: )
sighting cancelled if it tanks any further.....
edit - shouldn't have mentioned tanking should I - down it goes 😕
sighting cancelled if it tanks any further.....
edit - shouldn't have mentioned tanking should I - down it goes 😕
Attachments
Last edited:
Went long before the open so got spanked 😢 Wasn't that a H&S between 14.55 and 15.10? I thought it might have been at the time but ignored it as was convinced market was going up 😱 and if I had would have saved about 20 points. We now seem to be bouncing around the 32 - will wait to see which way it goes before going back for more.
It looks like bear flag, see how RSI climbs without Dow gaining points. As we speak, I think, another one in the making! However, PD in both CCI and RSI, so new low may be time to cover shorts. DOW bounced off the "magic 32".
Next target down: 390?
Well breaking as I write this. Lets see where the RSI end up at new bottom.
IyT just feels that this ride down is not yet over
Next target down: 390?
Well breaking as I write this. Lets see where the RSI end up at new bottom.
IyT just feels that this ride down is not yet over
tradesmart
Experienced member
- Messages
- 1,286
- Likes
- 22
Long 10375 - 'V' bottom sighting 😱
Hooya
From the history of intraday charts, I have shown that there are certain criteria for calling tops and bottoms, using divergences that have 3 peaks. One of the most important criteria is that there should be a minimum of 25 minutes between the 3 peaks. If it is a much shorter time, there will be a short term reversal, usually, but not a trend reversal. Calling the 3 peak divergences only signals the end of the major move. It does not indicate a "stop and reverse signal" although today, I think it will be a significant bottom. Time will tell.
From the history of intraday charts, I have shown that there are certain criteria for calling tops and bottoms, using divergences that have 3 peaks. One of the most important criteria is that there should be a minimum of 25 minutes between the 3 peaks. If it is a much shorter time, there will be a short term reversal, usually, but not a trend reversal. Calling the 3 peak divergences only signals the end of the major move. It does not indicate a "stop and reverse signal" although today, I think it will be a significant bottom. Time will tell.
tradesmart
Experienced member
- Messages
- 1,286
- Likes
- 22
Good support call CM!
Mom, my immediate target is 10432 (and perhaps we can hope for 10464 later! 😉 )
edit - anmolway - the 'V' bottom is also a long signal - it indicates v.strong support and an immediate direction reversal....
Mom, my immediate target is 10432 (and perhaps we can hope for 10464 later! 😉 )
edit - anmolway - the 'V' bottom is also a long signal - it indicates v.strong support and an immediate direction reversal....
Last edited:
Similar threads
- Replies
- 74
- Views
- 13K
- Replies
- 0
- Views
- 2K
- Replies
- 10
- Views
- 6K

