Dow Intraday Charts 01 Nov - 04 Nov

With the exception of T3, this was the easiest ride you'll ever see from bottom to top.Now and again you'll see RSI formations like today, but maybe just a couple.....Notice some of the RSI down channels are completely divergent if you take the top to bottom swing.
The key was getting in at the base line of 132. Then it was just a case of following the targets all the way up.The size of the pullbacks was surprising too, staing within the 'normal' range of 20 points. I would have expected at least 30 for such a big move up. Mind you, we got that towards the close- not surprisingly.Even so, it only went 25 ish.
 

Attachments

  • dow 04-11-04 1.gif
    dow 04-11-04 1.gif
    27.7 KB · Views: 292
I have been reading over these posts for a few months whilst paper trading. I tried the FTSE and failed miserably. I have tried many chart suplliers and fundamental and technical analysis. I'd tried Forex. I've spent many long nights drawing lines all over charts and starting again. I've refused to pay for learning, just studied and read what I could find online. I've had a good run on week/monthly trades on the DOW and I've narrowed my day trading to the DOW only.

After all the tried and tested theories I've put into practise and all the money lost, after 4 months of paper trading I started trading for real again this week and had a brilliant week. Just wanted to say thanks to this forum and all the guys and galls who post on this thread especially. Your insight has made this a great week so far. I've learnt a great deal and so much of what I've learnt deserves my thanks to you.

+ 180 on the week and month

Only one query... who would you recommend for live prices/charts? I've been using using Yahoo! and quote.com. Would anyone recommend anyone else?
 
Only one query... who would you recommend for live prices/charts? I've been using using Yahoo! and quote.com. Would anyone recommend anyone else?

Hi Chris, welcome to the forum.

I use Esignal for live prices (www.esignal.com) although it is quite expensive, about £65 a month I think. Their charting package is very comprehensive and easy to use.

Others use Sierra charts which are much cheaper. You will need a data feed which you can have free if you are an Interactive Brokers account holder. I personally couldn't get on with Sierra Charts but I guess it is down to personal taste.

You can try Sierra free for xxx??? days and you can try Esignal free for 1 month (providing you supply credit card details).

If you are intraday trading then live prices are essential, if you are taking a longer term view then 15 min delayed free quotes are good enough.

Hope this helps!

Justyn.
 
chrisw said:
I Only one query... who would you recommend for live prices/charts? I've been using using Yahoo! and quote.com. Would anyone recommend anyone else?

As already mentioned e-signal provide good charting package, also Q-charts from lycos seems to be fairly popular. If you are daytrading a decent chart package is essential, not to have one is a bit like driving using 'the force' instead of your eyes.
 
WD Chris, but don't get carried away!!!!! This week so far, has been relatively easy and without being rude, a bit of luck on the right side would have carried anyone a long way. Please take care and don't get blinded by your success. It will be just as easy to lose it all next week if you are not careful.
 
Cheers guys,

Yahoo! works fine for the longer two/three trades but the real trime charts are vital so I shall look into them all and hopefully find the best for me. I know what you mean Chartman, last time I traded for real before summer I managed to lose a lot of cash, so I certainly take more caution now.
 
My first ever clear 100....it's OK guys I 'll give myself a round of applause Thanksv :-0
 

Attachments

  • 2.1099651015956.mail.gif
    2.1099651015956.mail.gif
    62.5 KB · Views: 261
Thursday 4th November 2004

9:51 1) L 10131. Nice move up. Then stalls next bar.
9:57 EXIT +1. Then up more. Not going to chase.

Prices, the 100 ema and the 34 ema all flat-line around the 10130 level.

11:09 2) L 10145 after break out of wedge type formation and cross of the 100/34 emas. Not much follow through next bar. Then moves up sharply. Possible target around 180. 179 reached but not taken. Big mistake as it immediately reverses sharply.
11:25 EXIT +21. OK - but should have taken more from that move. Then straight back up to take 180 level and new high at 190. Not chasing again. Possible ND on RSI with TLB off this latest peak.

12:15 3) L 10194. Late and risky entry just below yesterday's recent highs at 10200 level. Also, CCI and RSI both gave possible entries one or two bars earlier for 10 + extra points on the trade. Nice move up to take out highs. Then stops.
12:23 EXIT +14.

Up to a new high at 10230 with more ND on RSI and CCI but it's not coming down yet. Then 240.

13:27 4) L 10250. I find it hard to enter when it's been going up and up but here goes. Well, keeps on going but not able to lock any profit in from first two bars.
13:35 EXIT +13. Closed early on potential reversal bar having touched R1 level.

Another one of those days when I've made good points, but would have done far better just to get long and stay there Up 130 points so far from my first entry). Maybe I need at least to look at a runner strategy!

And still it goes up.

14:51 5) L 10283. Again, instinctively I feel uncomfortable taking this trade so late into an up move but I'll take it and see. Sideways. Then breaks up again.
15:17 EXIT +22

+71 from 4 (note - not 79 as marked up on the charts)
+67 for the day after commissions
+70 for November so far after commissions

Looks like we topped out right at the upper band of the year long channel on the daily Dow. A possible retracement now before breaking up wards?
 

Attachments

  • 20041104.jpg
    20041104.jpg
    318.9 KB · Views: 205
Extra special well done to sall, welcome to the club. WD too TT, back in the black. :cheesy:
 
Hello everyone

A long time since I have posted I know but have just got rid of my old fire wall and installed a new one and guess what I can see the thumbnails again after 6 months.
I have been trading oil for a change and I am asking for a bit of help on my charts as I have had a huge spike today down to $40 that has messed up my charts something rotten. I use Sierra so I was hoping that someone may have some advice for me.

Thanks

Rustic
 
Yes you can edit the data although I I have tried in the past without much luck.Top of the charts/task bar/edit/data. You could also try deleting the .mnd file ( c:/sierra/data) for oil and then sierra will reload all the data again. This works if the data error has been corrected by the provider.....
 
Hi

I've attached the chart which speaks for itself. It would have been a good day for the channel rules today. Pity I didn't make the most of it. I took just one trade which I left too long expecting a big tri break south which never came. Stop-loss at BE means, in round figures I got zero points today :(

If only I could come up with an indicator to tell me when we are in a sideways day. I'm about to give up on that !


Bill (peed off....)

+-15 ema Rules are

1. Short if price crosses 100ema and touches/crosses 100ema+15.
2. Long if price crosses 100ema and touches 100ema-15.
3. Short if nd and price is 100ema +15 [or v close]
4. Long if pd and price is 100ema -15 [or v close]
5. Don't trade in the 1st hour
6. Stop losses above/below obvious SR
7. Don't open a trade in the last hour
 

Attachments

  • dow_051104.gif
    dow_051104.gif
    30.9 KB · Views: 197
  • mousesad.gif
    mousesad.gif
    9.9 KB · Views: 492
Can someone give me some advice please. I have been trying to Spreadbet trade intraday on the DOW. I am having difficulty because I use MyTrack 5 min charts and the IGIndex S/B prices don't seem to follow the prices which makes a nonsense of my entry and exit/stop values. Am I barking up the wrong tree using S/B and should I be using in the Futures area. I am reasonably successful selling PUT options which never seem to let me down so at least I am not losing all my money.
 
Friday 5th November 2004

Disappointing finish to a good week - especially as I should have done better today. I got stuck over-trading in the flat middle of the day and missed the runs either end...

Wary of chasing the opening gap so sitting on hands for a while.

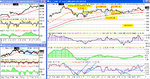
Possible entry at 10:21 on bar close having broken above R1 but I wimped out, not wanting to chase a 14 point bar. This was a mistake with hindsight as the trade would eventually have been good for +14, exiting at 10:33 on breaking the low of the previous bar. So I've missed 60 points of up movement since the open so far. No guts, no glory. Actually, there was a much better and lower risk entry three bars earlier at 366 which would have made +34.

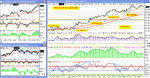
Market has also now broken out of my year long channel on the daily Dow.

Then missed out on the move back (but that's following my rules so I have to live with that).

11:51 1) S 10347 on possible break to downside after consolidation below 34 ema. Entry looks good but price struggling to break to downside.
11:54 EXIT -1. Then immediately breaks down. That's very frustrating - stopped out by 1 tick again.

Do I re-enter after 20 point long bar down? No, I'll have to leave it. I guess one solution in future could be to re-enter if the price breaks the previous bar back in the direction of the trade having first broken the opposite end to stop me out (i.e. forming an engulfing-type bar).

12:03 2) S 10334. Back in but this just doesn't want to go down here. Straight into big loss and full stop threatened.
12:05 EXIT -9.

Red bar, green bar. I've picked a great time to start entering trading here. I sat out two powerful moves - 1 up, 1 down - then started trading in a period of pure chop.

12:48 3) L 10380. OK, trying back on the long side now. Absolutely no follow through from entry. Then finally pops up 5m after entry but no great momentum and quickly drops off again.
12:57 EXIT b/e after all that.

13:24 4) L 10373. Try again but market gone very quiet here. Slowly creeping up.
13:34 EXIT +6. Not really going anywhere.

13:48 5) L 10381. Rubbish.
13:51 EXIT -4.

Frustrating Friday - looks like all the action was in the first two hours while I was sitting on the sidelines.

14:09 6) L 10381. This is getting silly - the market is clearly flat. Why do I keep entering? Smashes straight into loss.
14:15 EXIT -8.

That was one of the more stupid trades I have ever taken in a long time. Up until now I have limited the damage today despite no action since the time I took my first trade - that one trade has now doubled my losses from not bad to unacceptable and was absolutely unnecessary.

One decent long in the last half hour but I decided it was too late in the day/week to take any more entries by that stage.

-16 from 6
-22 for the day after commissions
+48 for November so far after commissions
 

Attachments

  • 20041105.jpg
    20041105.jpg
    322.2 KB · Views: 196
stevecartwright said:
Can someone give me some advice please. I have been trying to Spreadbet trade intraday on the DOW. I am having difficulty because I use MyTrack 5 min charts and the IGIndex S/B prices don't seem to follow the prices which makes a nonsense of my entry and exit/stop values. Am I barking up the wrong tree using S/B and should I be using in the Futures area. I am reasonably successful selling PUT options which never seem to let me down so at least I am not losing all my money.


Stevecartwright

S/P Will lose you money intrady,and what I read in to you post I think you trade the Dow cash,Rememberr the cash price is based around the futures price. On average the spreads are about 6 points. So if you trade 2 times a day you would need 60 points a week just to cover the spread. You best option is, open an account with open e cry or IB, with $4.04 to $5.00 round turn, Then you would only need 10 points a week to cover commission, on 2 trades a day.But you got to remember slippage, so this 10 points can go up. Then you got to worry about converting dollars in to pounds and finding the best deal.If you want to withdraw money form the USA brokage account.

If you are new to trading and got a S/P account, trade less, and try to hold a trade for 1 to 4 days,S/P is OK for this type of trading

CJ
 
Sort of consolidation, with a nice bull triangle forming, so some more upside to come. Plenty of room in RSI and CCI.
 

Attachments

  • dow 05-11-04 10.gif
    dow 05-11-04 10.gif
    38.9 KB · Views: 233
Much harder today, broadly consolidating.... Could you tell the difference at the open between what you might have seen as ND and what it really was which was consolidation, winding up for a move north? If you can't, go back and look at some ND setups.....and compare them with today's open. Broadly boring for the rest of the day, but should continue for a bit on Monday at least. At one point I thought the comp. was in the bag, but that's the way it goes. :eek:
 

Attachments

  • dow 05-11-04 1.gif
    dow 05-11-04 1.gif
    76.8 KB · Views: 221
Steve
It's a complex subject but it has been touched on before. Yes you will find the SB prices up to 20 points away from the cash price.Therefore you have to be sure of what you are doing. If you base your entry strategy on the cash price, you have to do the same with your exit. i.e. don't take an exit based on the SB price!!!! This is really hard to do and require a lot of understanding of how the SB price is calculated from the futures price and not the cash price. Search the boards for bias or spread bet bias. There you will find a lot of useful info.
There are lots on here that use SB and do OK. There are some that struggle too. There is no doubt, that if you have the funds, going direct access, with someone like IB is the way to go. 1 point spread, 1 point commission= a profit on 3 points. There is no "bias" either. the price you see is the price you get( almost). Going direct access means you can only trade the futures. There is no "cash" thing to trade.
Some people trade longer term on SB and intraday using IB direct access- best of both worlds.
 
Thanks Chartman for your reply, nice to be able to see your charts again.

I have found a way to edit the date to get rid of spikes.
Change chart to 1 min then hold mouse over bar and right click it will open uo a box you can then change the figures.

Hope this helps if anyone had the same problem.

Rustic
 
stevecartwright said:
Can someone give me some advice please. I have been trying to Spreadbet trade intraday on the DOW. I am having difficulty because I use MyTrack 5 min charts and the IGIndex S/B prices don't seem to follow the prices which makes a nonsense of my entry and exit/stop values. Am I barking up the wrong tree using S/B and should I be using in the Futures area. I am reasonably successful selling PUT options which never seem to let me down so at least I am not losing all my money.

Hi Steve

to add to what everyone else has said : if you open an account with IB you can take advantage of thier data feed, so there will be no discrepancy between the prices you're trading and the prices on the chart - its a free feed, too. The downside is there is no backfill, so if you're not connected to IB you end up with holes in your intraday data. Many people keep the MyCrap feed going as well so that you have historical data - not so much of a problem if you're using ADSL, but still a bit of a pain to have to have TWS open all day if you're not trading all the time.

Oh, and intraday SB will indeed be hard work.
 
Top