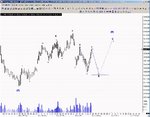
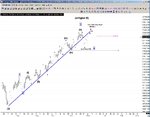
Dow 2006

ian said:
Manipulation or not, a run of 100 points is a trading opportunity not to be sniffed at or reasoned with or why. If they do that every other trading day then I will vote them back into office - bring it on - manipulation rules!

😎 😎 😎
Fine in theory but how are you going to pick the turns in practice ?
TA won't give you the indicators since it cannot factor this kind of intervention or manipulation into any chart so you will have to rely on guesswork, intuition, the toss of a coin or maybe the timing of high or low tides to determine you entry points to take advantage of them.

Thats not trading, it's just gambling 🙄 🙄
 
kriesau said:
Fine in theory but how are you going to pick the turns in practice ?
TA won't give you the indicators since it cannot factor this kind of intervention or manipulation into any chart so you will have to rely on guesswork, intuition, the toss of a coin or maybe the timing of high or low tides to determine you entry points to take advantage of them.

Thats not trading, it's just gambling 🙄 🙄

You mean you didnt spot that turn yesterday!!!....... OH MY GOSH!...I'VE GOT A MAGIC INDICATOR.....How do I sell this discovery of mine to the public?? I'll make millions, trillion, squillions,...Yours for only $29.99 and if you order today you will get a packet of cheesy puffs thrown in... 😱
 
kriesau said:
And then it suddenly and mysteriously found a second wind, turned on a sixpence and rocketed back up nearly 100pts in the last 90 minutes. That's the second day that this 'miracle' reversal has suddenly occurred in the afternoon.

LOL - Is there is anyone left who cannot see the degree of manipulation that is being applied to the markets at the moment. Paulson and the PPT have been holding an early Christmas party for the Bulls all week !

Intervention has been so blatent that I've been moving my stops to my entry point soon after a position has been triggered and this has saved me from losses on these 'reversals' at least three times this week !

I tend to agree that there's almost certainly some degree of manipulation going on! That was one hell of a bad week for data (& I thought that's what drives markets?!)...yet everytime it falls, there's always a spike up. I got stung for about 30 points of that late rise...thankfully it didn't look/feel right so I closed circa 12145. I'm wondering how many were like me? Perhaps, in the end it's agressive simply 'short covering' that makes sees the market spike up so dramatically.

It doesn't annoy me...it's all part of the game - also the longer it stays at these ludicrously bloated levels in the face of bad news, the more chance the inevitable unwinding will be disorderly - luvverly.
 
These spikes up and down are due in my view to the MMs, spread bet co's and others taking out the obvious stops ie 100 points on the Dow etc.
And therefore my learned friends I rest my case - not to have stops unless you are on holiday, in the loo for more than 2 hours etc.
QED
 
kriesau said:
Fine in theory but how are you going to pick the turns in practice ?
TA won't give you the indicators since it cannot factor this kind of intervention or manipulation into any chart so you will have to rely on guesswork, intuition, the toss of a coin or maybe the timing of high or low tides to determine you entry points to take advantage of them.

Thats not trading, it's just gambling 🙄 🙄
on big charts for SPX connect 10/26 and 11/13 tops 'that s your support line and 11/03 and 11/14 together is your resistasnce line for fri .....mon ..1405 res. 1380 then 1364 support.
,
 
ammo said:
on big charts for SPX connect 10/26 and 11/13 tops 'that s your support line and 11/03 and 11/14 together is your resistasnce line for fri .....mon ..1405 res. 1380 then 1364 support.
,
soxx broke big support ,rebounded,closed under support, big rebound was why mrkt whipsawed, incidently,when you are about to change a strong trend you start to see whipsaws
 
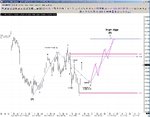
There was a well-defined support zone where the turn occured and it followed a minor 138% extension of the previous pullback. Happened around 20:00 too.
 

Attachments

  • untitled.JPG
    untitled.JPG
    276.9 KB · Views: 185
Just having a scribble on the 15min YM..

One option :?:
 

Attachments

  • bezdoodle2.jpg
    bezdoodle2.jpg
    190.9 KB · Views: 205
Last edited:
Bez said:
Just having a scribble on the 15min YM..

One option :?:
i favour the c leg down but complex in time and price
so expect waves rather than straight down
 
I just carn't seem to get a clean count into the Thursday late afternoon high @1408.75.. I keep seeing 3 waves of a exp flat b..???

hmmm instead of the X wave, we could always be label it down from thr 1408.75 as a 1,2 i,ii pattern which the bears would love...but its a bit to messy on the impulse and a bit to obvious for "bear-mist" count goggles leaving it wide open to any bull mischief...??

Maybe its just me 😱
 

Attachments

  • esbez.jpg
    esbez.jpg
    184.6 KB · Views: 172
Last edited:
ammo said:
soxx broke big support ,rebounded,closed under support, big rebound was why mrkt whipsawed, incidently,when you are about to change a strong trend you start to see whipsaws

Hi Ammo, I agree with your support levels. They are also backed up / supported by Fibanaci retracements of 23% (at 1364) from the 17th July and 61 % (at 1380) from the 3rd Nov.

I also believe we are heading for a Head & Shoulders reversal possibly by January. Once this is also confirmed with the braking of the 50 day moving average I hope to be shorting with bigger stakes.

Time will tell all...
 

Attachments

  • spx500-S+R.jpg
    spx500-S+R.jpg
    128.7 KB · Views: 230
Pardon me if I sound like Fred Flintstone but spx tested downside for one day on friday and made new highs the following day - pretty powerful stuff (imo).

Consequently, I'm waiting for the daily lows to be broken again - Friday was headfake on Spx...... so I'm waiting ....... as it continues to show strength!

My new "lazy trader" methodology may not suit everyone though - teehee!


Last Point
With last weeks lows around 1377 - 30pts from here roughly spx has massive comfort zone before Lazy T's will get itchy............

Small sop to Atilla and Growler (aka Mr Can) the spx is at an extreme and so good place to "look for" slippage....... 🙄
 
Last edited:
Bez said:
So odds favour the 5th of December will be the next time pressure point as a rotation point high.....

I posted that on the 29th as the 5th is the earlist time pressure triangle that a higher frame could come in with...However the 8th is a major key date... its 144 cally days from the 18th of July low and we know how the TA people both EW'ers & Gann love the fib number 144..

A good site is time&date but they don't include the 8th in the calc so it comes up as 143...

http://www.timeanddate.com/date/durationresult.html?m1=07&d1=18&y1=2006&m2=12&d2=08&y2=2006
 

Attachments

  • Bigcally144.jpg
    Bigcally144.jpg
    191.7 KB · Views: 210
Last edited:
Clearly we stopped just short of a new market high for the Dow Jones Industrial 30 index yesterday, however everything is poised for a new record high today. The question that is on everybody's lips is... just how high can the Dow go? With market propergators massaging upside momentum the possibilities are virtually limitless.
 
Bez said:
I posted that on the 29th as the 5th is the earlist time pressure triangle that a higher frame could come in with...However the 8th is a major key date... its 144 cally days from the 18th of July low and we know how the TA people both EW'ers & Gann love the fib number 144..

A good site is time&date but they don't include the 8th in the calc so it comes up as 143...

http://www.timeanddate.com/date/durationresult.html?m1=07&d1=18&y1=2006&m2=12&d2=08&y2=2006

Bez........... I'm a big fan of your work although still trying to get my thick head around it..
My calculator says 144d from July 18th low might be 9th Dec - but I could be totally wrong and apologise in advance.

Dec 11th also seems significant since that appears to be 180d from June 14th low. So Friday/Monday seems to be important for something - Friday being the 8th you identified.
 
Hi Hook shot ..

Thanks for the kind words, yes the time and date also gives 143 cally days from the July 18th low for Friday the 8th as they don't count the last day until its completed... I'm just including the friday as the market will be trading on its 144th day..🙂

Hope that kinda makes sense ???

I agree with monday as a pressure point as well...On these type of weekend time hits you often get a throw over first thing Monday morning, but at the mo I need the pattern just to show its hand a little more before it will be come clearer if it wants to throw over or not ...
 
Back
Top