Of all the articles I've read these last few days, this one seemed v interesting, but Rav won't like it.
Enjoy.
Chris
_____________________________________________________________________
Of the three major measures of the market, the DOW has held the strongest throughout the Bear market. This is perhaps explained by a natural "flight to quality" in light of dizzying losses in the Nasdaq from early 2003, as well as a litany of equity market scandals over the last few years – note that the DOW is comprised of the 30 mightiest American stocks. It is therefore natural that the DOW is right back here attempting to move towards its ATH far ahead of its counterpart benchmarks: the S&P500 and Nasdaq. In early May, the DOW came within 80 points, or less than 1% of its all-time high.
Over the last several weeks, the DOW has fought back and is now attempting to move into uncharted territory. Will it make it? Based on the entire technical picture across a multitude of frames, this is a very high possibility, and can happen within days.
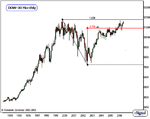
For this week's charts, let's take a look at the large picture on the monthlies for the DOW, and the real benchmark, the S&P500. Based upon what we will see, a move to the new high on the part of the DOW should not really be a cause for bullish celebration as it is likely going to be drummed-up to be by the media. Let's take a look: SEE chart 1
Chart Notations:
The Monthly chart of the Dow Jones Industrial Average above addresses the Intermediate-to-Long-Term time horizon.
Note the DOW has now far exceeded the .786 Fib retracement (red), which technicals suggests a high probability move to greater than 100% retracement. Because this means an ATH is in play, this is therefore a very significant technical signal.
A move to all-time high is always a move to "uncharted" territory, it will therefore be difficult to derive an initial target to where the market is likely to find its next peak. That's where our next chart will come in handy.
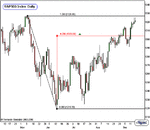
See chart 2
Chart Notations:
The Monthly chart of the S&P500 above addresses the Intermediate-to-Long-Term Time horizon.
In May, the S&P500 reacted to resistance from an important peak (marked in blue) in March of 2001 (the last peak before the WTC event).
At this point the S&P500 is back attempting to break through that level. Sustained trade above would put a move to the next technical resistance into play, and that is the .786 Fib retracement of the bear market (red). This level sits at approximately 1384.
If the DOW were to break to an all-time high very soon, it would likely drag the S&P500 along with it and therefore put the move to that .786 Fib mark at 1384 S&P500. If we were to translate this over to the Dow, then that means that if the DOW moves into ATH territory, the initial target there would be at approximately the 12,100 to 12,300 level.
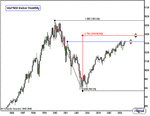
See chart 3
Chart Notations:
The Daily chart of the S&P500 addresses the very short-term time frame only.
Here we see the detail of the peak over this summer in early May. The S&P500 has since come back in a very strong way and already far exceeded the .786 fib retracement – the last frontier of technical resistance.
A new 5½-year high is in play, which coincides directly with the ATH in the DOW. Let's look for the market to keep pressing towards a new high over the next few days, particularly if it is trading in positive territory, and especially if exceeding prior day high.
Let us keep in mind that while the trend is up in this time horizon, the market is also pushed right-up against some very important resistance points in multiple time frames, so the best bet is to remain flexible here. There will be plenty of time to play the upside if the market breaks and sustains above resistance; and vice-versa to the downside, if the market gives us a significant reaction to resistance.


