Divergence Indicators

I would like to make a question.
In the case of stochastic ( and RSI ), in a specific trend ( up or down ), when the line reach the 50 level, does it mean it lost the momentum? or it mean it still has the rest to continue to move?.
By the other hand which would be the shortest time frame to use these kind of indicators (divergence)?.

I would say the 50% level crossing is a confirmation of the trend and not to be considered loss of momentum, at least statisticallly.

As for time frame, it is said the longer the better. I use 15 min and sometimes 30 min. with standard sto.
 
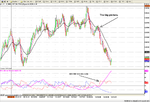
double divergence

Divergences are great to trade, if you know how to! Also majority of divergences do not work! so you have to set filters so that you do not get sucked into a false divergence trade.

My charting software draws automatic divergence and trendlines. I am looking for aNORMAL divergence in any one time frame PLUS also a HIDDEN divergence in any time frame - occuring at the same time!

Does it happen! Yes it does often, but not frequent. and when that happens it will give you a masiive move!

Eg, a bearish divergence say on a Daily, and then say a Bearish Hidden divergence on a 60 minute chart

try it out - results will be massive!

I miss sthg here as the very notion of trading two divergences at the same time is new to me: Hidden and regular divergences are to be traded in opposite directions, so wich one do I go ? One time frame must prevail, I thouht.
 
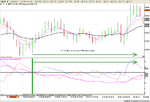
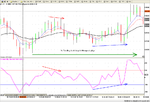
I actively trade off divergences using the CCI and ADX/DMI.

I only take a divergence on the CCI if the trend on the ADX is weakening.

There is a divergence taking place on GBPUSD but would not touch it with the ADX at these levels.
 

Attachments

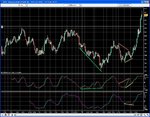
  • CCI3.png
    CCI3.png
    157.7 KB · Views: 632
  • CCI6.png
    CCI6.png
    132.1 KB · Views: 503
  • GBPUSD.png
    GBPUSD.png
    160.6 KB · Views: 453
I actively trade off divergences using the CCI and ADX/DMI.

I only take a divergence on the CCI if the trend on the ADX is weakening.

There is a divergence taking place on GBPUSD but would not touch it with the ADX at these levels.

Great charts, Stoploss.
I don't know about adx/dmi, but i guess you use them as additional confirmation for price direction? For the time being I just use low stochastics.
 
Divergence on it's own beit regular or hidden/reverse is not necessarilly high in probability as a stand alone signal to enter the market. It is better taken as part of a confluence of reasons to enter the market, . confirmed by price action itself,...like band/channel deviation and at pre-identified areas of potential support/resistance

If re-entering a trend on a hidden/reverse divergence, do so into a trend that exists on at least the next 2 time frames (the trend t/f (s) ) up from the chart that the hidden/reverse divergence presents itself on (the intermediate t/f,) and then drop down a time frame to find regular divergence or extreme readings in the oscillators to time your entry, (the trigger t/f) confirmed by price action itself. Of course the probability of a successful trade of this nature over any given sample is enhanced if you take entries that occur in this way at a pre-identified area of support/resistance and in this case where a previous now broken level/area of support in a downtrend is being re-tested from the underside following a pullback in the trend and that level/area now may act as resistance (SBR) -or- a previous now broken level of resistance in an uptrend is being re-tested from the top side following a pullback in the trend and that level/area may now act as support (RBS.) These are the areas at which you should look for hidden/reverse divergence on your intermediate t/f, with entry timed on your trigger, that may give you a high probability entry to the trend that you ahve identified that exists on the higher (trend) time frame (s.) Where no identifiable sbr/rbs exists it may be that you look to fib retraces, and of of course where these fibs co-exist with areas of sbr/rbs, so much the better.

In the case of regular/divergence, this can alert us to a change in trend/pullback/extended pullback and the more times frames that this exists on at a pre-identified area of support or resistance suggest the deeper the pullback may be/even an out and out trend reversal. It may be that you see regular divergence on some times frames and oscillator extreme readings on others and this too is a high priobability trading signal at pre-identified support/resistance.

One further word about diveregence, ...it is best to identify patterns that your chosen oscilator (s) make on the settings you have adopted,.. in respect of both regular and hidden/reverse divergence and to see if these repeat at these s/r/sbr/rbs areas.
 
A divergence play today off the 2584 and 610 Tick charts.

Not all divergences are equal and as such, it is good to know which ones to take and which ones to pass up.

In total agreement with BBMAC
 

Attachments

  • es1808a.png
    es1808a.png
    109.5 KB · Views: 417
  • es1808b.png
    es1808b.png
    100.3 KB · Views: 352
  • es18.08c.png
    es18.08c.png
    133.2 KB · Views: 351
None Trending divergences using ADX/DMI and CCI
 

Attachments

  • es18.08d.png
    es18.08d.png
    108.8 KB · Views: 385
  • es18.08e.png
    es18.08e.png
    101.3 KB · Views: 378
Divergence on it's own beit regular or hidden/reverse is not necessarilly high in probability as a stand alone signal to enter the market. It is better taken as part of a confluence of reasons to enter the market, . confirmed by price action itself,...like band/channel deviation and at pre-identified areas of potential support/resistance

If re-entering a trend on a hidden/reverse divergence, do so into a trend that exists on at least the next 2 time frames (the trend t/f (s) ) up from the chart that the hidden/reverse divergence presents itself on (the intermediate t/f,) and then drop down a time frame to find regular divergence or extreme readings in the oscillators to time your entry, (the trigger t/f) confirmed by price action itself. Of course the probability of a successful trade of this nature over any given sample is enhanced if you take entries that occur in this way at a pre-identified area of support/resistance and in this case where a previous now broken level/area of support in a downtrend is being re-tested from the underside following a pullback in the trend and that level/area now may act as resistance (SBR) -or- a previous now broken level of resistance in an uptrend is being re-tested from the top side following a pullback in the trend and that level/area may now act as support (RBS.) These are the areas at which you should look for hidden/reverse divergence on your intermediate t/f, with entry timed on your trigger, that may give you a high probability entry to the trend that you ahve identified that exists on the higher (trend) time frame (s.) Where no identifiable sbr/rbs exists it may be that you look to fib retraces, and of of course where these fibs co-exist with areas of sbr/rbs, so much the better.

In the case of regular/divergence, this can alert us to a change in trend/pullback/extended pullback and the more times frames that this exists on at a pre-identified area of support or resistance suggest the deeper the pullback may be/even an out and out trend reversal. It may be that you see regular divergence on some times frames and oscillator extreme readings on others and this too is a high priobability trading signal at pre-identified support/resistance.

One further word about diveregence, ...it is best to identify patterns that your chosen oscilator (s) make on the settings you have adopted,.. in respect of both regular and hidden/reverse divergence and to see if these repeat at these s/r/sbr/rbs areas.
thank BBMAC for this brilliant contribution and for reminding us rookies of the basics: s/r and price acton. If you don't mind, please post a chart when you have one that can illustrate your handling of divergences. Do you think hidden div. are less riskier than the regular, as they are a continuation pattern?

Yiehom
 
here is a potential change in trend in p/f.never go against the trend uneless you see conscutive signals.note amec, an uptrend.note consecutive double-bottom p/f signals
 

Attachments

  • AMEC ORD 50P.gif
    AMEC ORD 50P.gif
    41.6 KB · Views: 334
thank BBMAC for this brilliant contribution and for reminding us rookies of the basics: s/r and price acton. If you don't mind, please post a chart when you have one that can illustrate your handling of divergences. Do you think hidden div. are less riskier than the regular, as they are a continuation pattern?

Yiehom

See attached doc, which are pertinent extracts in relation to your question lifted from another doc. Open with MS word.

As for your question about which type of divergence is riskier, arguably hidden divergence is safer as it is used to re-enter a trend that exists on your trend+ time frame, on your intermediate time frame that it sets-up on, possibly with entry timed on your lower trigger frame. When you think about it,.. using divergence as part of any technical factors to enter a market, whether it be hidden or regular requires an entry that is against the trend on your intermediate time frame and lower, even if entering a trend that may exist on your higher trend t/f.

Regular divergence/extremes on it's own does not necessarilly indicate a complete trend reversal but perhaps only a trade-able pullback/retrace at an area of supp/res...if then the trend continues from an area of sbr/rbs that doesn't mean that the regular divergence failed, it simply was indicating a pullback, the potential strength of which can be indicated by other factors too, such as strength of supp/res, the trend's relationship with the intraday and longer average ranges, and how many time frames the regular divergence/extremes in oscilators exists upon.

Similarly if you act on a hidden divergence that is not at an immediate lower high in a downtrend/ higher low in an uptrend, then the chances of that divergence producing a with trend follow thru are possibly diminished.
 

Attachments

  • Oscillator Divergence from price.doc
    187.5 KB · Views: 1,462
bbmac.thanks for the input.i have reformatted youre document in pdf format.it looks a lot better.i think
 

Attachments

  • Oscillator Divergence from price[1].pdf
    169.8 KB · Views: 1,552
Thanks dentist.

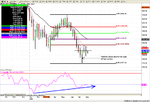
Example today...below is the 1hr chart showing the previous swing lows that acted as resistance (sbr) at 8638area...(lets call this the trend t/f chart) Note too the Low on that trend t/f at 8537 (today's intraday low) being higher than the last Lower Low (LL) of the downtrend on that t/f, at Friday's low ( 8512) ....an early warning of a potential trend change?? (would be confirmed by a break of the last significant Lower High on that trend t/f at 8722 area

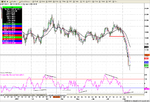
The chart below that being the 15min chart (intermediate) showing hidden divergence but at a HH on that chart although still at a LH on the trend t/f (1hr) notwithstanding the last Low being higher than the last LL of the downtrend on that trend t/f.

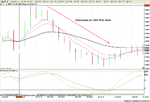
..Now drop down to the 5min as a trigger to time entry and you will see oscillator extremes....(3rd chart below) the re-test of the potential sbr area showing regular divergence.

So far as I write this the set-up at a this pre-identified sbr area has failed to see a with trend follow thru,...(see comments in previous postings above.) although it resulted in a 55pip fall.
 

Attachments

  • 1hr.gif
    1hr.gif
    11.6 KB · Views: 564
  • 15min.gif
    15min.gif
    22.2 KB · Views: 441
  • 5min.gif
    5min.gif
    18.6 KB · Views: 353
Last edited:
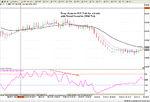
Just for further clarity and particularly for any one reading this thread that knows of my trading style, so as not to confuse anyone...you will know that actually I trade with a 30min trend t/f, 5min intermediate and 1min trigger measuring potential support/resistance with the 1hr+ previous swings, fibs and pivots...the 1min trigger set-up comprising regular divergence at the 1hr potential SBR shown in first chart above is shown below;

1min Rev C
 

Attachments

  • 1min.gif
    1min.gif
    23.7 KB · Views: 489
Bullish Regular Divergence then Bullish Hidden Divergence and *Bullish Angle Divergence on Spot Gold this afternoon prior to the strong move through R @ 804-805 at the third attempt.

*my own description of the Failed Bearish Hidden Divergence pattern due to Price Action.
 

Attachments

  • Spot Gold 190808 144 tick chart.JPG
    Spot Gold 190808 144 tick chart.JPG
    229.5 KB · Views: 622
just thought i would put in on how to spot a divergence in point and figure.you cant....
but you can see if the columns in the direction of the trend are gettiing shorter or longer.ie go down a box size so you get more reversals and columns and then look at the characteristics of the column lengths.then line it up with s/r
enclosed is a chart of cable.a long term chart.box size is 1.3%.reversal is 3.ie 3.9% of price needed to reverse the column.notice there is a long reversal column going down to 8561.you can see this is a long column ,so expect some reversal.also put on are vertical counts with targets.these are long term and are only a guide.however the trend is still up on this chart/long term
 

Attachments

  • USD_GBP Spot.gif
    USD_GBP Spot.gif
    19 KB · Views: 447
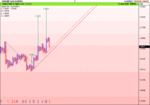
Nice example today in gbpusd where support became resistance (sbr) and there was clear hidden divergence in both the 15 and 30min charts with regular divergence on the lower 1 and 5min charts to time the entry at the sbr area. Such technical conditions at a pre-identified potential sbr area made for a high probability set-up, confirmed as it was by price action itself

The chart shown is the 30min and you can see how the previous asian session support (green dotted line) acted as resistance on a retest from the underside following a pullback from the 8539lows. The area also coincided with previous 1hr swing lows also,.. making it a potentially stronger area where support may become resistance.
 

Attachments

  • 30min.gif
    30min.gif
    20.5 KB · Views: 399
Hello!
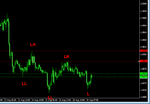
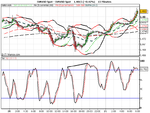
This is what I took for a hidden divergence yesterday night and went short the eur/usd. Just to be saved by my stop. I hadn't waited for price confirmation, since it was bed time for me. Can you see another mistake ?

Yiehom
 

Attachments

  • EURUSD Spot.png
    EURUSD Spot.png
    23.8 KB · Views: 471
Hello!
This is what I took for a hidden divergence yesterday night and went short the eur/usd. Just to be saved by my stop. I hadn't waited for price confirmation, since it was bed time for me. Can you see another mistake ?

Yiehom

4 points really imo

1. You are correct in saying that you did not wait for price action confirmation in the form of a reversal candle (bearish) Indeed you could have dropped down to the 5min chart and sought some regular divergence or oscillator extremes

2. What area of former support that may now act as resistance had you identified at that level?

3, You had no band/channel breech/deviation as a further technical factor to short at this level.

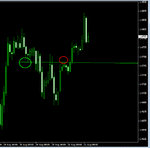
4. Price put in a Lower High at 4707 area off the Lows at 4675 then a Higher low at 4683 area before the run up which meant that you were trying to re-enter at something other than an immediate Lower high on this t/f, meaning the chances of success are potentially diminished. (I do still trade these but am wary on targets/only hold if momentum is good off the potential sbr/rbs) I'm assuming the downtrend that you were attempting to enter was that of the 1hr and indeed this was in a downtrend at the time, and the entry you sought was at a lower high on that time frame...you can see from the chart below how price did indeed sell off from 4750-30 before another rally higher and at that point (20:50pm Uk time) there was indeed a 5min regular divergence set-up to short.

The chart attached shows the previous intraday support (green circled) that briefly acted as resistance [sbr] (red circled) at that 20:50pm uk time, slightly higher than your entry, but within your stop.
 

Attachments

  • t2w.gif
    t2w.gif
    12.9 KB · Views: 464
Last edited:
there was no trend.
basically.hidden divergence is a larger pullback than previous pullback in an existing trend.ie an up or down move.not a flat move.therefore you must examine the trend only on a lower t/f and look for the bigger p/b


This is what I took for a hidden divergence yesterday night and went short the eur/usd. Just to be saved by my stop. I hadn't waited for price confirmation, since it was bed time for me. Can you see another mistake ?

Yiehom[/QUOTE]
 
Top