Diary of a swing spread better

barjon said:
split

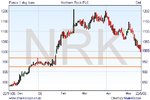
now that you're out of it i'd be interested in your take on nrk.

for me nrk changed trend to down in early april (arrowed) after breaching the earlier swing low. the first substantial re-action in the new trend gave a swing high and short entry (yellow circle) but it was not one i took (curses :devilish: ) because of the preceding messy action (a potential swing high - dotted red line - confused by going xd the next day).

you can see, maybe, why i was a bit startled by your trade :)

good trading

jon

ps: sorry - dotted red line missing - but you can see where it would be

Jon,

I hang my head in shame. Isn't it a clear shorting example? I think that NRK should go down to that R/S area on my chart, don't you?

Split
 

Attachments

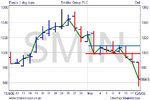
  • SMIN.JPG
    SMIN.JPG
    35.9 KB · Views: 149
Last edited:
hungvir said:
I refered to your 970 post by the way, Elefteros. We should celebrate when we have 1000 posts here. All in about 90 days :)

You have completely lost me on this one :confused:
 
Splitlink said:
Jon,

I hang my head in shame. Isn't it a clear shorting example? I think that NRK should go down to that R/S area on my chart, don't you?

Split


split

so what's smin got to do with the price of beans :LOL:

hope you haven't been at the sangria too early :eek:

cheers (hic)

jon
 
barjon said:
split

so what's smin got to do with the price of beans :LOL:

hope you haven't been at the sangria too early :eek:

cheers (hic)

jon

:eek:
 

Attachments

  • NRK.JPG
    NRK.JPG
    37.6 KB · Views: 150
hungvir said:
Hi Split,

We have a sunny day here in London after some rainy ones. May be that's why the market is going up this morning :)

H

Hung,

You could be right about the weather having an inpact on the markets !! ;)

Looks like this "correction" may be coming to an end, as the FTSE seems to be recovering well today!!!! For those who use Fibonacci, its interesting to note that it bounced off the 38.2% level today!!! Maybe it will turn me into a Fib Retracement "believer" :cheesy:

Also, just taken a look at my "Oily" portfolio and all the stocks are blue today, which is a welcome sight + Wolseley is up as well.

Fingers crossed for the next few days.............

Chorlton
 
chorlton,

your fine till friday then its rain so brace yourself for another red day.
 
Elefteros said:
chorlton,

your fine till friday then its rain so brace yourself for another red day.


Ah.... Good Point......

Who needs TA when we have the local weather forecast ;)

On a serious note, what opinion does anyone have on today's rise in the FTSE?? If you draw a line from the lows since 2004, the underlying uptrend still seems to be intact (but only just!!!)

I think this recent low (5520 ish) was a crucial level and luckily so far we seem to have bounced back up...........
 
Chorlton,

Your gonna turn me into an invester getting to look at charts going back to 2004 :LOL:

But since you opened the can i believe this is the beggining of a downward trend that will last the next 3 years, any upwards movement will simply be a pullback.

Take a look at a 10 year chart of the ftse and you will notice we get 3 up years followed by 3 down followed by 3 up again,

this year were due to see the start of 3 down years so brace yourselves, its when markets change their primary trend that people lose the most as it takes time to c that the trend really has changed.
 
.....or you could see it as 5 years up 1995-2000, followed by 3 years down, then another 5 up to come :eek: . so 2 more years to go :cheesy:


or you could see it as ...........................................................

good trading

jon
 
Barjon youve hit the nail on the head,

Thats the whole point that once you start looking at charts in terms of years you end up as an invester or you look at it and disregard what you c as there will be so many shorting/buying opprtunities within the primary trend as it swaggers up and down
 
Elefteros,

How come you sound so gloomy when you're still long the DOW :)

The FTSE went up 146 points today and when the market can rise that much in one day it shows that there's nothing rational about it. I stil need two more up days to start hunting for short opportunities though.

Good trading,

Hung
 
Elefteros said:
You have completely lost me on this one :confused:

I meant to reply to your post #970 but did not quote it. Just after I sumitted the post I realised there was another reply in between. Still confused? :)
 
barjon said:
split

now that you're out of it i'd be interested in your take on nrk.

for me nrk changed trend to down in early april (arrowed) after breaching the earlier swing low. the first substantial re-action in the new trend gave a swing high and short entry (yellow circle) but it was not one i took (curses :devilish: ) because of the preceding messy action (a potential swing high - dotted red line - confused by going xd the next day).

you can see, maybe, why i was a bit startled by your trade :)

good trading

jon

ps: sorry - dotted red line missing - but you can see where it would be

Hi Jon,

Looking at the NRK chart you posted, you would have been stopped out if you'd shorted at the first swing high, wouldn't you. The question is why did you wait for the next swing high that looked like the trend might have changed to up yet again? Just curious.

Thanks,

Hung
 
Splitlink said:
Not that one! It was pretty old and had one or two holes in it on the down side that my shares slipped through!

Split

I got the wrong one then. Had more than two holes in it :)

I think when traders start out, there's a tendency to overuse indicators. But when they have your level of experience, their sixth sense will have been developed to the extent that indicators won't be that important after all. For me, I have to try them all and decide which ones work for me and which one don't. My next quest is studying candlesticks, Elliot waves and Fibonacci in details. I may or may not end up using them but I have to know.

Cheers,

Hung
 
hungvir said:
Hi Jon,

Looking at the NRK chart you posted, you would have been stopped out if you'd shorted at the first swing high, wouldn't you. The question is why did you wait for the next swing high that looked like the trend might have changed to up yet again? Just curious.

Thanks,

Hung

hung

yes, but i explained that i thought.

i was doubtful of it as a swing high because of moving to ex-dividend next day (div was about 20p i think). so i wouldn't (and didn't) trade it because of that and i wouldn't have done anyway because of the gap opening. the reason i didn't trade the substantive swing high was because of that earlier messy action (as you say, there was a possibility that the uptrend had re-asserted itself if that earlier swing high had indeed been true).

good trading

jon
 
Thanks, Jon.

It is when it gets messy like this that I lose faith in TA :) Just kidding.

With regards to going ex-dividend, I have always thought that the price would drop on the day and a short would have more chance of success?

And now I can see why your wife has been beating you (is she still?) with her buy and hold approach. Studdying the market day in day out is just energy sapping and does not guarantee a jackpot.

Later,

Hung
 
hungvir said:
I got the wrong one then. Had more than two holes in it :)

I think when traders start out, there's a tendency to overuse indicators. But when they have your level of experience, their sixth sense will have been developed to the extent that indicators won't be that important after all. For me, I have to try them all and decide which ones work for me and which one don't. My next quest is studying candlesticks, Elliot waves and Fibonacci in details. I may or may not end up using them but I have to know.

Cheers,

Hung


Hung,

Personally, I feel that candlesticks are a useful tool. At the very least they can convey information "visually" quicker than say with bars but thats only my opinion.

With regard to Indicators, ultimately I would like to be in a similar situation to Split, where I could rely on only price action & volume to trade. VSA offers some interesting ideas as to what to look for but IMO finding these set-ups proves quite difficult especially when swing trading stocks over a number of days.


Good Luck to All,

Chorlton
 
Hi Chorlton,

I actually have a super thick book about candlestick from an Oxfam shop that I haven't read. Hope I'll have time to scan thru it soon.

What is VSA by the way?

Cheers,

Hung
 
hungvir said:
Hi Chorlton,

I actually have a super thick book about candlestick from an Oxfam shop that I haven't read. Hope I'll have time to scan thru it soon.

What is VSA by the way?

Cheers,

Hung


VSA (Volume Spread Analysis).

If you're interested a good book relating to it is "Undeclared secrets that drive the stock Market" by Tom Williams
 
Thanks, Chorlton. I'll look for the book on eBay.

Now it looks like I am preparing for a thesis on TA :)

Good trading,

Hung
 
Top