Diary of a swing spread better

Digitallook's 'heat map' for today looks depressing. Just a handfull of shares managed to go up by a pathetic number of points.

I've decided to trade only companies whose share price is under 500p. I'll probably be bored to death with some of them. But it will probably save my poorly funded account from bleeding to death. I think the shake-up of my watch list is no less dramatic than Blair's recent cabinet reshuffle 🙂

I still keep EMG and MKS because they made me money in the past and I quite like them. I'll refine the list further after checking their charts.
 

Attachments

  • heatmap.jpg
    heatmap.jpg
    407.8 KB · Views: 166
  • lis.jpg
    lis.jpg
    387.8 KB · Views: 151
interesting that you went short at that pice hung, I'm looking at the 11100 area as a nice support level a spring board if you like for the dow to bounce up from, but then i'm biased as i'm still long at the moment.
 
It was one of those moments when I could not find the word 'discipline' in the dictionary 🙂 But once the 11125 resistance line was broken (then the 1140 line) I knew the game was over.
 
By the way, I can't sleep being long in this market. The DOW IMO will eventually come down to the 50 per cent Fibs retracement line.
 
Stopped out of NRK at 1007 -5 points. I was going against my own advice on this one but was trying for a bounce,as I have had a good week and am feeling flush! I should have hung (no pun intended 😛 ) on to GUS a while longer instead of doing something stupid like buying NRK.

Chorlton,

You were right, I don't use indicators. I switch over to a 5 or 10 minute chart and when I see that ,after three or so bars, the price doesn't seem to want to go lower, I buy. I don't need more indication than that. That is not to say that I am right all the time but, it seems to me that indicators based on data going back several bars are very much out of date and I don't have confidence in them. It must be remembered, too, that the longer one waits for confirmation the farther the price is getting from the preferred stop. A lot of traders prefer to have room for the price to move up and down but I cannot see the point in that. The more one waits for that the further one gets from the preferred stop and the more risk must be accepted. For that reason, I prefer to trade pullbacks to breakouts. But you have to be certain of the trend, of course. 😱 I was fighting a falling market for several days the week before last before I got it right.

Apart from the practicality of indicators (or lack of) I have the impression that a lot of guys go deep into the advantages of one against the other. The time they must spend! You only have to read through the site!.

As for Fib ( and I really love you all and no nastiness intended), if one can understand where the support and resistance is, there is no need for them, either.

Take care and have a good day tomorrow.

Split
 
Split,

Thanks for your comments !!

You mention that you switch over to a 5 & 10min chart so would I be right in assuming you day trade?


Splitlink said:
Stopped out of NRK at 1007 -5 points. I was going against my own advice on this one but was trying for a bounce,as I have had a good week and am feeling flush! I should have hung (no pun intended 😛 ) on to GUS a while longer instead of doing something stupid like buying NRK.

Chorlton,

You were right, I don't use indicators. I switch over to a 5 or 10 minute chart and when I see that ,after three or so bars, the price doesn't seem to want to go lower, I buy. I don't need more indication than that. That is not to say that I am right all the time but, it seems to me that indicators based on data going back several bars are very much out of date and I don't have confidence in them. It must be remembered, too, that the longer one waits for confirmation the farther the price is getting from the preferred stop. A lot of traders prefer to have room for the price to move up and down but I cannot see the point in that. The more one waits for that the further one gets from the preferred stop and the more risk must be accepted. For that reason, I prefer to trade pullbacks to breakouts. But you have to be certain of the trend, of course. 😱 I was fighting a falling market for several days the week before last before I got it right.

Apart from the practicality of indicators (or lack of) I have the impression that a lot of guys go deep into the advantages of one against the other. The time they must spend! You only have to read through the site!.

As for Fib ( and I really love you all and no nastiness intended), if one can understand where the support and resistance is, there is no need for them, either.

Take care and have a good day tomorrow.

Split
 
Chorlton,

It is not my intention to day trade, but to try to find the tops and bottoms for the day and and hold. Most of them are held overnight apart from the stopped ones. If I like the profit I may close the same day. I use ten minute charts as a confirmation instead of using indicators. When I can I move my stop into just above break even.

Split

Split
 
hungvir said:
By the way, I can't sleep being long in this market. The DOW IMO will eventually come down to the 50 per cent Fibs retracement line.

And for those of us that dont know where might that be hung?
 
Splitlink,

I completely agree with you about indicaters, however for me they do serve one purpose and that is to add discipline to my trades and stop me over trading, when your going it alone on a system you use its very easy to over trade or try to trade both sides in a choppy market could be very costly
 
That would be around 10880. And if it does not stop there then I don't know if we still can call this a bull market.

You can see from the chart below that we can quite safely bet that another up day (or two) is on the card because the DOW has been oversold for some days now. And when it starts to go down again after that I'll surely go short. Not the DOW though as it's too big for me.

Good trading,

Hung
 

Attachments

  • dow.jpg
    dow.jpg
    165 KB · Views: 145
I refered to your 970 post by the way, Elefteros. We should celebrate when we have 1000 posts here. All in about 90 days 🙂
 
Splitlink said:
Stopped out of NRK at 1007 -5 points. I was going against my own advice on this one but was trying for a bounce,as I have had a good week and am feeling flush! I should have hung (no pun intended 😛 ) on to GUS a while longer instead of doing something stupid like buying NRK.

Chorlton,

You were right, I don't use indicators. I switch over to a 5 or 10 minute chart and when I see that ,after three or so bars, the price doesn't seem to want to go lower, I buy. I don't need more indication than that. That is not to say that I am right all the time but, it seems to me that indicators based on data going back several bars are very much out of date and I don't have confidence in them. It must be remembered, too, that the longer one waits for confirmation the farther the price is getting from the preferred stop. A lot of traders prefer to have room for the price to move up and down but I cannot see the point in that. The more one waits for that the further one gets from the preferred stop and the more risk must be accepted. For that reason, I prefer to trade pullbacks to breakouts. But you have to be certain of the trend, of course. 😱 I was fighting a falling market for several days the week before last before I got it right.

Apart from the practicality of indicators (or lack of) I have the impression that a lot of guys go deep into the advantages of one against the other. The time they must spend! You only have to read through the site!.

As for Fib ( and I really love you all and no nastiness intended), if one can understand where the support and resistance is, there is no need for them, either.

Take care and have a good day tomorrow.

Split

Very interesting approach, Split. What's the probability on that? 70/30?

For indicators, I think they're additional tools to help traders with trend confirmation. I for one am a trend follower, not predictor and I do need the MA to point towards the sky to buy and to the ground to short 🙂

Good trading,

Hung
 
Elefteros said:
Splitlink,

I completely agree with you about indicaters, however for me they do serve one purpose and that is to add discipline to my trades and stop me over trading, when your going it alone on a system you use its very easy to over trade or try to trade both sides in a choppy market could be very costly

Yes. I do tend to sound off a bit when indicators are mentioned. I believe that the construction of them tends to become a hobby in itself, rather than the thrill 🙄 of trading. The last one I threw out was the Bollinger Band , quite a long time ago.

Now I have been liberated. Indicator free! 😆

This morning I have been living on the fringe with WOS, which I shorted at 1203.8. It went within a hair of my stop at just under 1215. I thought that this might be a pullback entry point when I went in but it went higher. It gets lonely living on the fringe.

Split
 
Hi Split,

We have a sunny day here in London after some rainy ones. May be that's why the market is going up this morning 🙂

H
 
And I just caught the BB that you threw out. Not sure when it'll be my turn to throw it on 🙂
 
My two 'darlings' MKS and EMG are going in two opposite direction this morning. MKS is down by 30 points and EMG is up nearly 40. But I am flat at the moment and will stay flat for a while. Work is too demanding.
 
And this time I won't break the rule. If there're no three up days I won't go short. So today may be the first one.
 
hungvir said:
And I just caught the BB that you threw out. Not sure when it'll be my turn to throw it on 🙂

Not that one! It was pretty old and had one or two holes in it on the down side that my shares slipped through!

Split
 
split

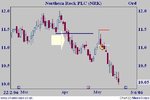
now that you're out of it i'd be interested in your take on nrk.

for me nrk changed trend to down in early april (arrowed) after breaching the earlier swing low. the first substantial re-action in the new trend gave a swing high and short entry (yellow circle) but it was not one i took (curses 😈 ) because of the preceding messy action (a potential swing high - dotted red line - confused by going xd the next day).

you can see, maybe, why i was a bit startled by your trade 🙂

good trading

jon

ps: sorry - dotted red line missing - but you can see where it would be
 

Attachments

  • nrk.JPG
    nrk.JPG
    28.5 KB · Views: 157
Back
Top