First: I'm not speaking english correctly. Please, be tolerante, and if You don't understand anything, ask.
I'm researching the fibonacci numbers and systems in other areas. (mainly in music)
My view is, that as it is teached, it is a little far from the reality.
I tell you the basic theory begind the fibonacci.
Every system consists of some of similarities. (Think about very-very simple things.)
There is some basic ratio, that is quite frequent in the life. The first is the 1:1 ratio (later:1.0 ratio), that is a similarity between the two part. The second is the 1.618:1 ratio (later: 1.618 ratio), and in it there is similarity in the ratios. (1.618/1 = (1+1.618)/1.618)
The 1.0 ratio is the 0.5 and 2.0 level of fibonacci tool. (0.5 level is actually 0.5:0.5 ratio, and 2.0 level is 1:1 ratio, each is similar to 1.0 ratio) You say, it is a fibonacci level, but it is really not. Fibonacci was a rabbit breeder, and in the breeding he noticed the fibonacci sequence: 2,3,5,8,etc. This sequence is not connected with the 1:1 ratio retracement. It is only connected with the 1.618 ratio.
The fibonacci levels are the 0.382 (0.618 + 0.382 = 1; 0.618/0.382 = 1.618), 0.618 (1/0.618 = 1.618), 1.618 (1.618/1 = 1.618), and 2.618 (1+1.618 = 2.618; 1.618/1 = 1.618).
In an other approach:
The golden ratio is consists of three distance: A,B and C. B is beside to A, and C is A+B. There is two ratio. One is between A and B, and one is between B and C. (There is a third, between A and C, but now it is not relevant)
----- for matematicians: -----
If the A:B = B:C, and x is the ratio,
B = 1, A=1/x, C=1*x. A+B=C, so 1/x+1=x. If you organize it, You get this: ( - x^2) + x + 1 = 0.
This is a second level equation, and the result is x = (1+sqrt(5))/2 = 1.618
sqrt() = square root
----------------------------------
So, the two ratio, B:A and C:B is 1.618:1.
Now we can get the four fibonacci level from this.
If C=1, A = 0.382, B = 0.618.
If B=1, C = 1.618, A = 0.618 and A is belong to B, so the level that we use, is actually equal to C.
If A=1, C = 2.618, B = 1.618 and B is belong to A, so the level that we use is actually equal to C.
I hope, I'm understandable.
For this reason, I use the following fibonacci levels: (it includes the non-fibonacci 1:1 ratio also)
0.382; 0.5; 0.618; 1.618 (and the mirror of it: -0.618); 2.0 (and the mirror of it: -1.0); 2.618 (and the mirror of it: -1.618)
And as I use it: Not that set the two line to the top and bottom, and wait for the retracement. No.
I set it to the retracement, and see, which lines are at a significant top or bottom. This is a basic use of it, but You can use it in the conventional way, and You can set the basic lines (0% and 100%) at any significant lines. You can notice that there is no 24%, 79% etc. levels, because there is no direct connect between the whole (100%) and this levels. If you set the 0 and 1 to the most recent top and bottom (the top or bottom and the retracement), you have the necesary lines between those lines.
In this set of lines, the all levels are connected with the basic lines. So, you must set the basic lines to the most significant lines, and you will see, if there is any relation to the others.
For example, if there is three point, x, y and z, you can set the basic lines first to the x and y, next to the y and z, and next to the x and z. What if you have 7 point? 🙂) Be combinative, intelligent, and don't think, that the real truth is wrote in the books. Select the more significant points, and try it.
The market is same complex as the nature. If it wasn't complex, we all could make money.
If the price makes a turn, there is a reason. News, fibonacci, or any. It is quite frekvent, when the reason is fibonacci. Open the EURUSD weekly chart, and you will see, that the turn around 2008 sept. 07 is a 50% retracement.
The other wrong thing when you can read, that there is a retracement around the 62% retracement, or more bad, between the 50% and 62% retracement. If the reason was the fionacci, the turn should be exactly, or nearly exactly at the level. If it is not at the level, you haven't found the reason. If you follow the live price, you should pay attention to the turning at the exact levels. If there is no significant level at the turning point, chance is that the price will go onward.
Sorry. I'm soo long, but it is a complicated subject.
The bottom line is that you shouldn't think, that the market is simple, and that the books are always right, (because it cannot be written. You should get experience about it) and you should always use your combinativity, creativity, and intelligece when follow the price.
--------------------------
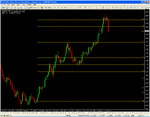
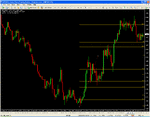
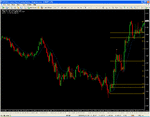
Go down, I have posted an example.
Last edited:


