LTC and EOS – Breakout seen but would it be confirmed?

LTC/USD
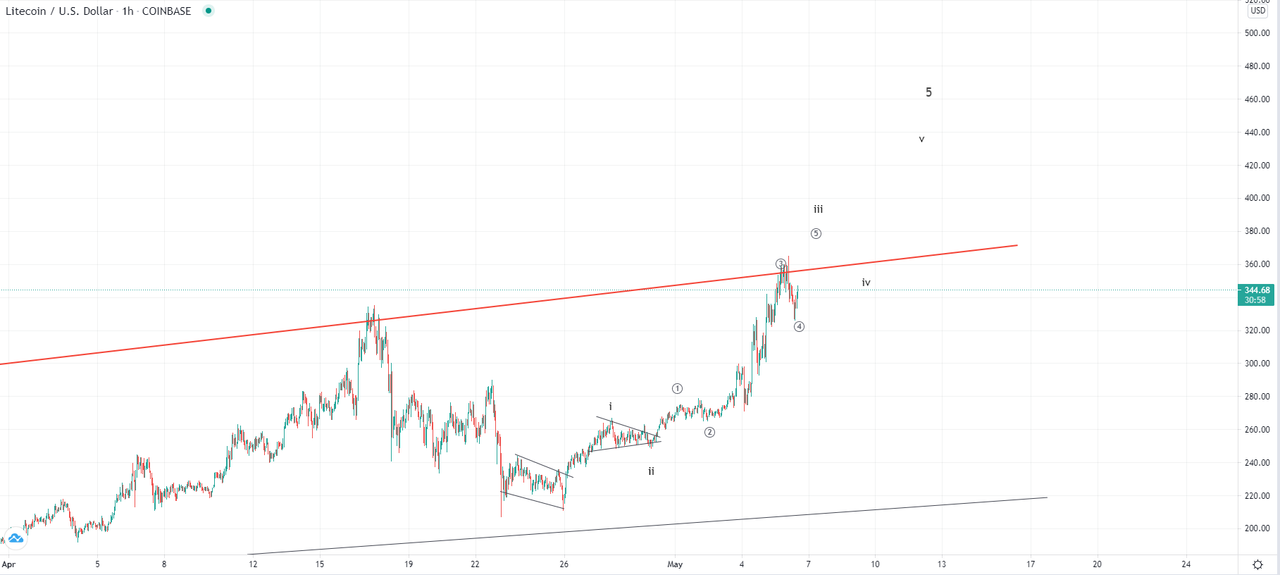
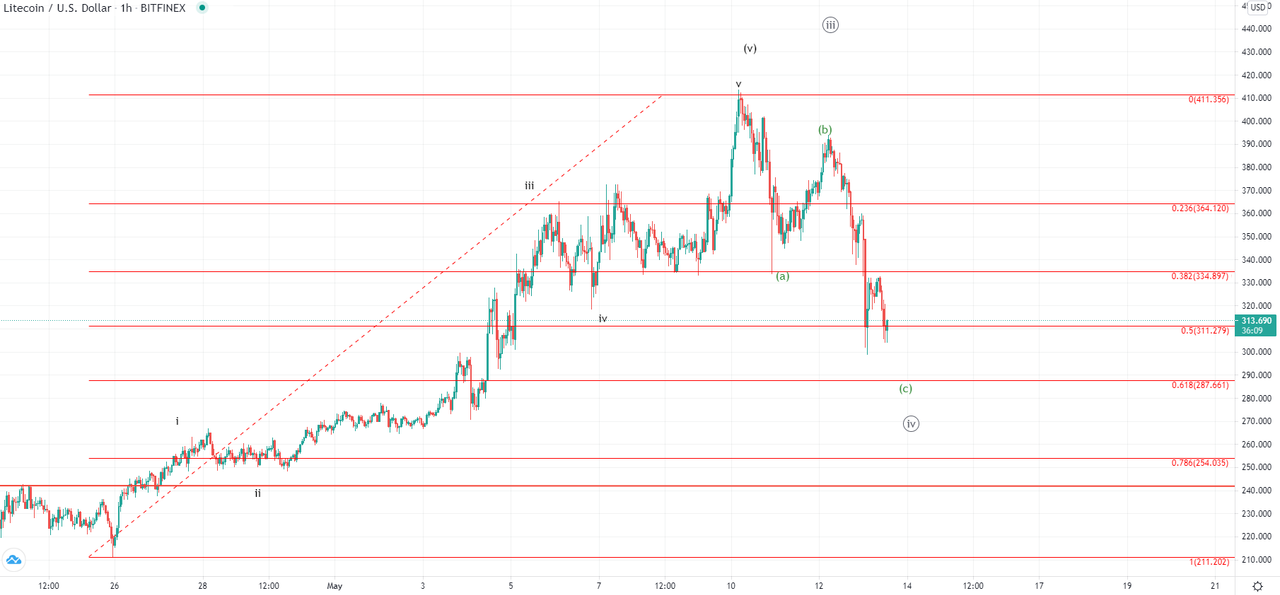
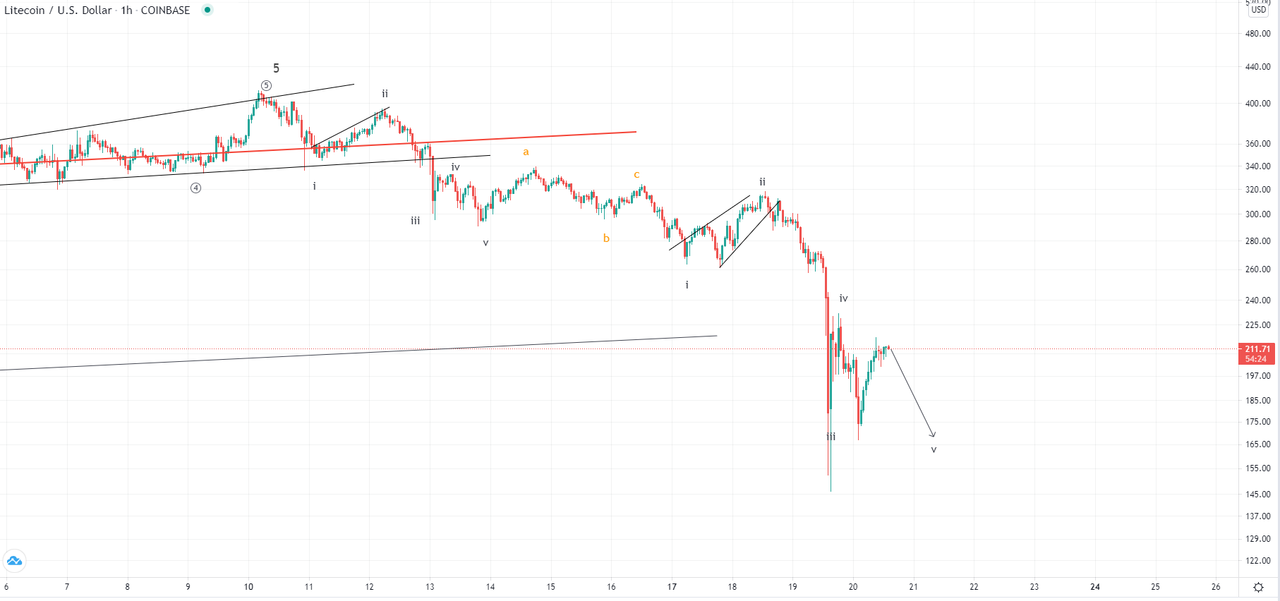
The price of Litecoin has been on the rise since the 26th of April when it fell down to $211. From there we have seen an increase of 26.4% as it came up to $266.6 at its highest point. It started moving sideways from yesterday’s high and is currently sitting slightly lower but is in an upward trajectory overall.
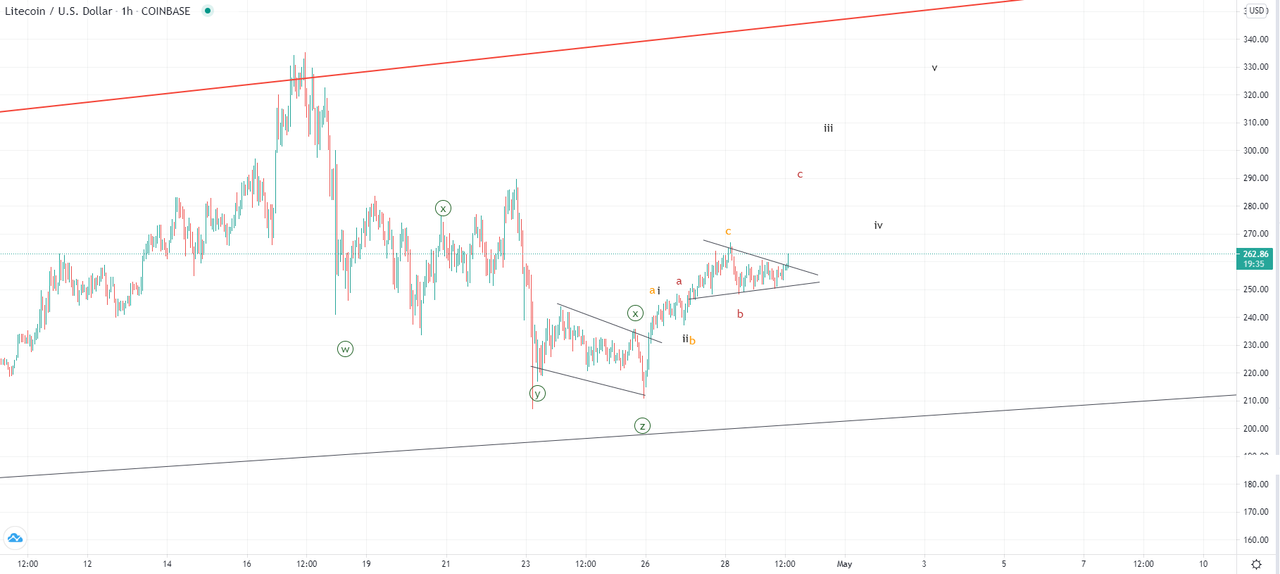
On the hourly chart, we can see that the price has started breakout out from the symmetrical triangle in which it was since yesterday’s high. This could be an early indication that the price is now headed further up. However, a confirmation is needed which could come as the hourly candle close above the territory of the symmetrical triangle and then a successful retest of its resistance for support
The previous descending move has definitely ended as a five-wave correction however it is still unclear how the current rise would end and which type of structure it could form. There are three possible scenarios in play. The first being that we are seeing the starting five-wave impulse in which case its third sub-waves 1st wave has developed. The next one is slightly negative and considered the rise from the 26th as the ABC correction with more upside potential for the C wave. The third one is the most negative one and implies that the ABC correction to the upside already ended in which case we are now seeing the start of the next descending move with the symmetrical triangle being its 2nd sub-wave.
Read Full on FXOpen Company Blog...

LTC/USD
The price of Litecoin has been on the rise since the 26th of April when it fell down to $211. From there we have seen an increase of 26.4% as it came up to $266.6 at its highest point. It started moving sideways from yesterday’s high and is currently sitting slightly lower but is in an upward trajectory overall.

On the hourly chart, we can see that the price has started breakout out from the symmetrical triangle in which it was since yesterday’s high. This could be an early indication that the price is now headed further up. However, a confirmation is needed which could come as the hourly candle close above the territory of the symmetrical triangle and then a successful retest of its resistance for support
The previous descending move has definitely ended as a five-wave correction however it is still unclear how the current rise would end and which type of structure it could form. There are three possible scenarios in play. The first being that we are seeing the starting five-wave impulse in which case its third sub-waves 1st wave has developed. The next one is slightly negative and considered the rise from the 26th as the ABC correction with more upside potential for the C wave. The third one is the most negative one and implies that the ABC correction to the upside already ended in which case we are now seeing the start of the next descending move with the symmetrical triangle being its 2nd sub-wave.
Read Full on FXOpen Company Blog...


