You are using an out of date browser. It may not display this or other websites correctly.
You should upgrade or use an alternative browser.
You should upgrade or use an alternative browser.
Best Thread Correlation Trading - Basic Ideas and Strategies
Only if you know how big the initial spike is going to be! I have a natural talent for buying right at the top of it, seeing it retrace and then waiting all morning for it to claw its way back up to where I entered. God, I wish I had a mole at National Statistics dept - get in a minute before, get out 5 mins later and take the rest of the week off!sorry alerts went nuts so couldnt resist this one on the GBP solo chart
is that a buy signal ? :smart:
N
NVP
Guest Author
- Messages
- 37,966
- Likes
- 2,158
Only if you know how big the initial spike is going to be! I have a natural talent for buying right at the top of it, seeing it retrace and then waiting all morning for it to claw its way back up to where I entered. God, I wish I had a mole at National Statistics dept - get in a minute before, get out 5 mins later and take the rest of the week off!
agreed !
everyone says dont EVER chase the trade....but when you watch 50+ pips stright off the Bat on G/U its sole destroying....
reminds me of another trading quote - Better Never than Late.....
N
NVP
Guest Author
- Messages
- 37,966
- Likes
- 2,158
agreed !
everyone says dont EVER chase the trade....but when you watch 50+ pips stright off the Bat on G/U its sole destroying....
reminds me of another trading quote - Better Never than Late.....
N
its not retracing ! 😱
N
Ingot54
Well-known member
- Messages
- 403
- Likes
- 62
Hi all
before I dissapear off on work stuff....
the Tag had a rough night and are in divorce mode......
so lets get a little quiz going here ......riddle me this one on current forex action...and tell me what direction you would predict the tag are going next...its kinda there to see.....
c'mon we wont bite !
N
Hi Neil
The markets are in turmoil - in short - no one knows what to do or how to trade them.
Long term trends ... Gone!
Indicators - Unreliable or simply stopped working!
Have a look at the USD Index - currently flat.
EURUSD - ready to plunge, according to the 4H chart, but I won't trade it, because it will not obey the signals.
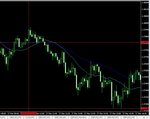
Have a look at the attached chart of EURUSD 4HOUR - what a nice 4H candle there at the top of the intermediate up-trend. It is telling us, or normally would be telling us that the long term down-trend is about to resume.
I should be taking a long term short here, with support at 1.3650 and 1.3450 and 1.3276 and 1.3075 and so on.
The big test will/would be 1.3450, but again, I have lost confidence in this market.
I used to think the FX markets were beyond manipulation, but of course I know better these days. What we CAN trade though, is the Fundamentals, and that is something that takes time to develop, and requires traders to be very patient over weeks.
I doubt many of our readers would want to wait for Christmas for payday ... but that is what we are looking at with this market, suffering interference as it is.
If, of course, you are a short term trader using 15 min TF then you can disregard the above. Keep in mind that I have only been right about 2% of my trading life 😱
And of course, now that I have stated that the GBPUSD will retrace, it will probably rally!!
EDIT: OOPS! I meant EURUSD!
Attachments
Last edited:
jrplimited
Active member
- Messages
- 249
- Likes
- 1
Hi N and all,
Looked liked markets all round were a bit flat pre my session start so this morning was a case of attempting to tread carefully - little did I know!
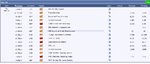
GU; First trade entered short at 52113 on open 08:10 bar and price immediately went into a rapido reverse gear and SL taken out by 08:20 bar for 21 pip loss. Price moved into a fairly tight range after this but weak bias appeared to be on down side so sell stop set at 52156 and 09:10 bar came within a few pips of filling this but price retreated away again and carried on with its sideways drift in a slightly higher range, then came panic as news release declared UK had won lottery prize of half a trillion Dollars so making current defecit problems a thing of the past.... Or something like that! 09:30 bar exploded into life and shot upwards so, unusually for me, buy button hit and fill taken with large slippage at 52687 during this rocket launch. Price paused at 09:35 then moved up again, went into a two bar stagger and moved upwards again with some more momentum from 09:55 then found a top at 10:15 and drifted downwards after this. Trouser changing trade exited on close of 11:00 bar for a 66 pip profit.
EU; First trade short at 37837 on 08:10 bar, price rose slightly then strated to drop slowly southbound with a couple of pauses at 08:35 and 09:20 then it made new local low at 09:40 so TS set up to see if I could track lower moves but this just got taken out by wick of 09:45 bar for 6 pip profit. No more setups after this.
EG; First trade entered long at 90570 on open 08:05 bar, price moved up then rolled over, found some support below entry price and tried to rally again but couldnt and low of 09:05 bar hit SL for 15 pip loss. Second trade short entered at 90432 on open 09:20 bar, price popped up immediately then retreated to just above entry point then that 09:30 explosion took hold and pushed price right down without looking back. New local low made at 10:15 then price started to wander around a little before pushing upwards, trade exited on close of 10:45 bar for 61 pip profit.
A real roller coaster day and lady luck was on my side for second EG trade as I had absolutely no idea of how that 09:30 news release would impact the market and that second GU trade had incredible slippage as buy button hit when price initially breached chart's local high by good amount, bit dicey to do this sometimes but with GU recovering well lately from sick bed the gamble actually paid off fo a change.
Definitely another day to simply now switch off and get outside and do some gardening whilst muttering to myself - cue men in white coats visit to casa moi! Trade well and regards,
Simon.
Looked liked markets all round were a bit flat pre my session start so this morning was a case of attempting to tread carefully - little did I know!
GU; First trade entered short at 52113 on open 08:10 bar and price immediately went into a rapido reverse gear and SL taken out by 08:20 bar for 21 pip loss. Price moved into a fairly tight range after this but weak bias appeared to be on down side so sell stop set at 52156 and 09:10 bar came within a few pips of filling this but price retreated away again and carried on with its sideways drift in a slightly higher range, then came panic as news release declared UK had won lottery prize of half a trillion Dollars so making current defecit problems a thing of the past.... Or something like that! 09:30 bar exploded into life and shot upwards so, unusually for me, buy button hit and fill taken with large slippage at 52687 during this rocket launch. Price paused at 09:35 then moved up again, went into a two bar stagger and moved upwards again with some more momentum from 09:55 then found a top at 10:15 and drifted downwards after this. Trouser changing trade exited on close of 11:00 bar for a 66 pip profit.
EU; First trade short at 37837 on 08:10 bar, price rose slightly then strated to drop slowly southbound with a couple of pauses at 08:35 and 09:20 then it made new local low at 09:40 so TS set up to see if I could track lower moves but this just got taken out by wick of 09:45 bar for 6 pip profit. No more setups after this.
EG; First trade entered long at 90570 on open 08:05 bar, price moved up then rolled over, found some support below entry price and tried to rally again but couldnt and low of 09:05 bar hit SL for 15 pip loss. Second trade short entered at 90432 on open 09:20 bar, price popped up immediately then retreated to just above entry point then that 09:30 explosion took hold and pushed price right down without looking back. New local low made at 10:15 then price started to wander around a little before pushing upwards, trade exited on close of 10:45 bar for 61 pip profit.
A real roller coaster day and lady luck was on my side for second EG trade as I had absolutely no idea of how that 09:30 news release would impact the market and that second GU trade had incredible slippage as buy button hit when price initially breached chart's local high by good amount, bit dicey to do this sometimes but with GU recovering well lately from sick bed the gamble actually paid off fo a change.
Definitely another day to simply now switch off and get outside and do some gardening whilst muttering to myself - cue men in white coats visit to casa moi! Trade well and regards,
Simon.
Attachments
'Tis now! What's the betting this rise in the £ will reverse completely by tomorrow?its not retracing ! 😱
N
I've just been going through a thread on the CCFp indicator over at ForexFactory, and I see on the last couple of pages someone called NVP pop up, so I'm now wondering if your Corrie uses the same calc's as CCFp? I've currently got them both running in MT4 but the cpu load gets pretty hairy at times, so it'd be useful to know so I can delete whichever uses up more resources... I see a pretty decent match between them when using the corrie at longer settings, but I can't seem to get the CCFp down to the same resolution as the corrie at, say, 21/1, so I'm using it at the moment for a longer-term view.
Do you know if anyone got the CCFp down to a more sensible cpu load? I've got it limited to 180 bars, so it's manageable but it'd be nice if some whizzkid had recoded it more efficiently.
Hi N and all,
Looked liked markets all round were a bit flat pre my session start so this morning was a case of attempting to tread carefully - little did I know!
GU; First trade entered short at 52113 on open 08:10 bar and price immediately went into a rapido reverse gear and SL taken out by 08:20 bar for 21 pip loss. Price moved into a fairly tight range after this but weak bias appeared to be on down side so sell stop set at 52156 and 09:10 bar came within a few pips of filling this but price retreated away again and carried on with its sideways drift in a slightly higher range, then came panic as news release declared UK had won lottery prize of half a trillion Dollars so making current defecit problems a thing of the past.... Or something like that! 09:30 bar exploded into life and shot upwards so, unusually for me, buy button hit and fill taken with large slippage at 52687 during this rocket launch. Price paused at 09:35 then moved up again, went into a two bar stagger and moved upwards again with some more momentum from 09:55 then found a top at 10:15 and drifted downwards after this. Trouser changing trade exited on close of 11:00 bar for a 66 pip profit.
EU; First trade short at 37837 on 08:10 bar, price rose slightly then strated to drop slowly southbound with a couple of pauses at 08:35 and 09:20 then it made new local low at 09:40 so TS set up to see if I could track lower moves but this just got taken out by wick of 09:45 bar for 6 pip profit. No more setups after this.
EG; First trade entered long at 90570 on open 08:05 bar, price moved up then rolled over, found some support below entry price and tried to rally again but couldnt and low of 09:05 bar hit SL for 15 pip loss. Second trade short entered at 90432 on open 09:20 bar, price popped up immediately then retreated to just above entry point then that 09:30 explosion took hold and pushed price right down without looking back. New local low made at 10:15 then price started to wander around a little before pushing upwards, trade exited on close of 10:45 bar for 61 pip profit.
A real roller coaster day and lady luck was on my side for second EG trade as I had absolutely no idea of how that 09:30 news release would impact the market and that second GU trade had incredible slippage as buy button hit when price initially breached chart's local high by good amount, bit dicey to do this sometimes but with GU recovering well lately from sick bed the gamble actually paid off fo a change.
Definitely another day to simply now switch off and get outside and do some gardening whilst muttering to myself - cue men in white coats visit to casa moi! Trade well and regards,
Simon.
Hi Simon
I've been so impressed with your reports that I've spent ages scouring this thread looking for an explanation of the gubbins on your charts (taking my eye off the ball and closing a trade where I shouldn't have just now, dumbass that I am) but I can't find anything. Is it a trade secret, or are you happy to share? I'd be satisfied hearing how you exit positions if nothing else - your consistent gains look really good.
jrplimited
Active member
- Messages
- 249
- Likes
- 1
Hi Simon
I've been so impressed with your reports that I've spent ages scouring this thread looking for an explanation of the gubbins on your charts (taking my eye off the ball and closing a trade where I shouldn't have just now, dumbass that I am) but I can't find anything. Is it a trade secret, or are you happy to share? I'd be satisfied hearing how you exit positions if nothing else - your consistent gains look really good.
Hi GMP,
Just back in from gardening as my two daughters have returned from school, so being the hopeless fx addict that I am I fired up pcs again just to see whats happening.
Answering your Q in general, I use a policy of trading across three pairs (my fab 3 or GU, EU and EG) wherever possible so if hitting a loser on one then the plan (ha!) is that other two should at least minimise this or at best eradicate this - sometimes this doesnt work and I'm left nursing a rather large loss on the day but thats trading life for you!
I use chart flags as exits. or simple eyeballing, or a measure of what I term as a previous up / down "base" formation, or pure panic when price viciously turns against me! Further "controls" over my alarming tendency to shoot everything in sight in the saloon are only trading from 08:00 through to midday London local time and stopping at either a combination of two wins on the trot, or two losses on the trot, or three trades in total (ie lose, win then lose etc), or if any trade yields more than X pip profit where X is a simple rule-of-thumb % measure of a typical intraday swing move - example of that is if I hit a 45 pip profit on GU then to me this represents a large proportion of a normal swing, so I'll stop trading on this pair.
Utiising M5 time frame allows me to "see" quite a few potential exhaustion points amidst all the usual noise, so placing a TS on non zero / five numbers around these works well, but in the main its the chart's flags which I use and rely upon the most.
Regarding the "gubbins" on my charts, its taken me a fair time to create these and the main (price) chart is virtually a momentum based algorithm whilst the sub (histogram) chart is a very kiss based measure of immediate price action. I dont use any lagging indicators as these leave me cold, besides which M5 time frame moves rapidly without any real regard to whats happened N bars in the past.
If you want to know more about the above then drop me a pm or mail as I'm currently working with NVP on this also - his goal is to break free of slavery and join us all on the dark side!
Simon.
Thanks Simon, interesting stuff. Looking at your charts, I was assuming you were using some mechanical exit but it sounds as experiential as my own GTFO method, if somewhat more successful judging by your results! I've found the morning session more tradeable than the afternoons too - I think it's the combination of American institutions waking up and their economic data being released at our lunchtime that messes everything up. I've often made 50 pips or more in a morning (a target I'm more than happy with) only to lose it all after lunch, but do I learn?
I'm clocking off now but I'll probably be in touch tomorrow if I can think of anything to bring to the table.
Cheers - Gavin
NVP
Guest Author
- Messages
- 37,966
- Likes
- 2,158
Hi Neil
The markets are in turmoil - in short - no one knows what to do or how to trade them.
Long term trends ... Gone!
Indicators - Unreliable or simply stopped working!
Have a look at the USD Index - currently flat.
EURUSD - ready to plunge, according to the 4H chart, but I won't trade it, because it will not obey the signals.
Have a look at the attached chart of EURUSD 4HOUR - what a nice 4H candle there at the top of the intermediate up-trend. It is telling us, or normally would be telling us that the long term down-trend is about to resume.
I should be taking a long term short here, with support at 1.3650 and 1.3450 and 1.3276 and 1.3075 and so on.
The big test will/would be 1.3450, but again, I have lost confidence in this market.
I used to think the FX markets were beyond manipulation, but of course I know better these days. What we CAN trade though, is the Fundamentals, and that is something that takes time to develop, and requires traders to be very patient over weeks.
I doubt many of our readers would want to wait for Christmas for payday ... but that is what we are looking at with this market, suffering interference as it is.
If, of course, you are a short term trader using 15 min TF then you can disregard the above. Keep in mind that I have only been right about 2% of my trading life 😱
And of course, now that I have stated that the GBPUSD will retrace, it will probably rally!!
EDIT: OOPS! I meant EURUSD!
Hi Ivan.....
great to have you on the thread my friend (everyone Ivan was an early corrie pioneer with me)
EURUSD ?.....heres what happened next yesterday.....not a bad call my friend 👍
why is it everyone is bloody good except me ? 😢
N
Attachments
Last edited:
NVP
Guest Author
- Messages
- 37,966
- Likes
- 2,158
Hi N and all,
Looked liked markets all round were a bit flat pre my session start so this morning was a case of attempting to tread carefully - little did I know!
GU; First trade entered short at 52113 on open 08:10 bar and SL taken out by 08:20 bar for 21 pip loss. 09:30 bar exploded into life and shot upwards so, unusually for me, buy button hit and fill taken with large slippage at 52687 Trouser changing trade exited on close of 11:00 bar for a 66 pip profit.
EU; First trade short at 37837 on 08:10 bar, for 6 pip profit. No more setups after this.
EG; First trade entered long at 90570 on open 08:05 bar, low of 09:05 bar hit SL for 15 pip loss. Second trade short entered at 90432 on open 09:20 bar, price popped up immediately then retreated to just above entry point then that 09:30 explosion took hold and pushed price right down without looking back. New local low made at 10:15 then price started to wander around a little before pushing upwards, trade exited on close of 10:45 bar for 61 pip profit.
Trade well and regards,
Simon.
hey mate......I new you'd be on it....👍
N
NVP
Guest Author
- Messages
- 37,966
- Likes
- 2,158
'Tis now! What's the betting this rise in the £ will reverse completely by tomorrow?
I've just been going through a thread on the CCFp indicator over at ForexFactory, and I see on the last couple of pages someone called NVP pop up, so I'm now wondering if your Corrie uses the same calc's as CCFp? I've currently got them both running in MT4 but the cpu load gets pretty hairy at times, so it'd be useful to know so I can delete whichever uses up more resources... I see a pretty decent match between them when using the corrie at longer settings, but I can't seem to get the CCFp down to the same resolution as the corrie at, say, 21/1, so I'm using it at the moment for a longer-term view.
Do you know if anyone got the CCFp down to a more sensible cpu load? I've got it limited to 180 bars, so it's manageable but it'd be nice if some whizzkid had recoded it more efficiently.
Hi mate ............i'm NVP on FF , TSD Forex, T2W and whenver I comment at moneyweek + henry liu's blog etc etc................shimples !
as mentioned in my very early posts here...(c1937 - when JRP and I were in shorter dresses) the FXCorelator is a Hybrid of work done by TRO (who appears sometimes here) and FerruxFX (an unbelievable programmer)......who based their hybrids on the grandaddy of strenghtmeters......the CCFPp
in truth I cannot remember the details but Corrie shows USD in its purest form...moving freely alongside the other G7.......The TRO and FerruFX Versions were USD based as Strengthmeters with the USD placed on as "decoration" (ie any zero crossover was a curency crossing its USD pair)
also the FXcorrelator is based on some of the simplest coding ive seen......KISS !
on the FXCorrelator the Zero line is the G8 average price line - not affiiated at all to the USD......so in the Corrie if USD line crosses another currency thats its pair MA crossover point (and not the zero line)
I still use these versinos somtimes as to be honest most of us just watch the X pairs so having the usd as a base is good call......you can easily reprogramme any Currency to be the baseline if needed ..............
go onto FF as the CCFP is still dscussed at length by programmers with PHd brains !
N
Last edited:
NVP
Guest Author
- Messages
- 37,966
- Likes
- 2,158
Hi Simon
I've been so impressed with your reports that I've spent ages scouring this thread looking for an explanation of the gubbins on your charts (taking my eye off the ball and closing a trade where I shouldn't have just now, dumbass that I am) but I can't find anything. Is it a trade secret, or are you happy to share? I'd be satisfied hearing how you exit positions if nothing else - your consistent gains look really good.
oh no.......this will cost me a new KB dress...😢
N
NVP
Guest Author
- Messages
- 37,966
- Likes
- 2,158
Hi GMP,
Just back in from gardening as my two daughters have returned from school, so being the hopeless fx addict that I am I fired up pcs again just to see whats happening.
Answering your Q in general, I use a policy of trading across three pairs (my fab 3 or GU, EU and EG) wherever possible so if hitting a loser on one then the plan (ha!) is that other two should at least minimise this or at best eradicate this - sometimes this doesnt work and I'm left nursing a rather large loss on the day but thats trading life for you!
I use chart flags as exits. or simple eyeballing, or a measure of what I term as a previous up / down "base" formation, or pure panic when price viciously turns against me! Further "controls" over my alarming tendency to shoot everything in sight in the saloon are only trading from 08:00 through to midday London local time and stopping at either a combination of two wins on the trot, or two losses on the trot, or three trades in total (ie lose, win then lose etc), or if any trade yields more than X pip profit where X is a simple rule-of-thumb % measure of a typical intraday swing move - example of that is if I hit a 45 pip profit on GU then to me this represents a large proportion of a normal swing, so I'll stop trading on this pair.
Utiising M5 time frame allows me to "see" quite a few potential exhaustion points amidst all the usual noise, so placing a TS on non zero / five numbers around these works well, but in the main its the chart's flags which I use and rely upon the most.
Regarding the "gubbins" on my charts, its taken me a fair time to create these and the main (price) chart is virtually a momentum based algorithm whilst the sub (histogram) chart is a very kiss based measure of immediate price action. I dont use any lagging indicators as these leave me cold, besides which M5 time frame moves rapidly without any real regard to whats happened N bars in the past.
If you want to know more about the above then drop me a pm or mail as I'm currently working with NVP on this also - his goal is to break free of slavery and join us all on the dark side!
Simon.
GMP.....you cannot believe how much Simon is playing down the time and blood he has spent creating his "gubbins"........
N
NVP
Guest Author
- Messages
- 37,966
- Likes
- 2,158
Thanks Simon, interesting stuff. Looking at your charts, I was assuming you were using some mechanical exit but it sounds as experiential as my own GTFO method, if somewhat more successful judging by your results! I've found the morning session more tradeable than the afternoons too - I think it's the combination of American institutions waking up and their economic data being released at our lunchtime that messes everything up. I've often made 50 pips or more in a morning (a target I'm more than happy with) only to lose it all after lunch, but do I learn?
I'm clocking off now but I'll probably be in touch tomorrow if I can think of anything to bring to the table.
Cheers - Gavin
Hi Gavin
welcome on board .............the FXcorrelator seems to help already good traders with an indicator that gives them an overview of the market all the time.....Helicopter vision you could call it.......
I think its even beter for newbies as you can immediately see what going up and whats going down........shimples !
N
NVP
Guest Author
- Messages
- 37,966
- Likes
- 2,158
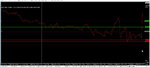
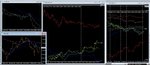
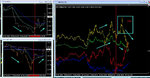
popped in for a squizz...........hmm
thats a 1m corrie on the right.......Euro is off of the page on the 5min isnt it !
(big divergences on currency strengths at the moment)
8.20 saw a major turnaround and correlations are working nicely so far.....as gold went above $1120 the USD was a decent sell into the Eurotwins.......
Yen looks very volatile today ....that boxed area was a real kick as it was turning down.......Yen is as bad as GBP re having nasty kickbacks....😏
or you could have bought gold as the falling USD made Gold more attractive to buy in other strengthening currencies.....one reinforces the other usually....:smart:
N
Attachments
Similar threads
- Replies
- 0
- Views
- 3K