patricio_w
Member
- Messages
- 86
- Likes
- 1
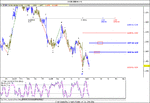
It was only an update of my last chart of last week, heres all the analysis, with updated 1440m and 60m data charts
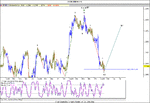
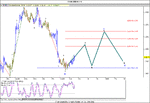
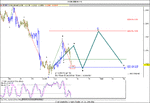
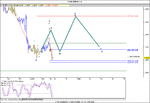
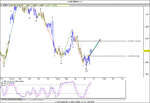
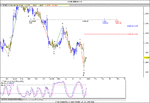
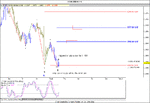
1h Chart.
If Dec2 low till 25jan high is a W1 or a WA, then we could see eventually a declain till 1.1991 and 1.1913, thats the typical retracements for a W2 or WB, not shown in the chart becasuse i can put them all together. This downside should last until 15 to 17 of february, but in the short-term should be limited by the 1.2072
If you want a recomendation about this chart i suggest to go long followint ht e oscilator, in the short term the 1.2072 is a nice stop loss, but the view is bearish in the middle term
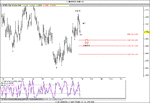
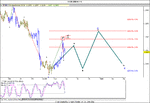
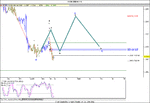
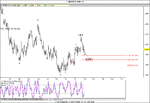
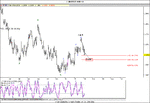
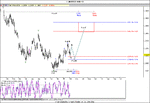
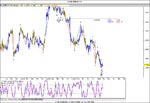
1440 m.
Here is the new chart. Time limit for the end of this W2 or B is 20th of feb, should be limited by the 0.618 fibo ratio that is 1.1901
In the short time, my count is bullish, limited by 1.2072 Wave A of W2 or B ??, if that is correct we shall see a rally looking for wb of the ABC of W2 or B
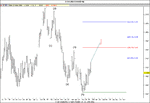
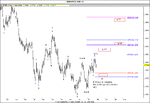
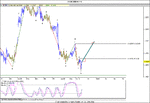
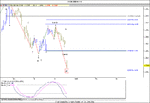
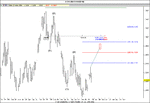
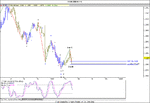
10080 m data.
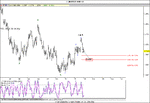
On the weekly chart iam posting a 1.2.3.4.5 wave count on the downside y pretty clear, and this is a correction than should be limited at 0.618 fibo ratio 1.2891 in price, about time, this correction shoul not excedd ending of April, 20 of april to be accourated.
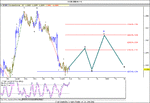
This is all for now, to resume this, in the very short term my count is bullish, in the short middle my count is side ways, rather bearish, lookinf for more correction of this possible W2 or b, on the middle - long term trade my count is bullish
My kindest regards to all of you

