Chuck, Dick, Ricky, and Jack

Dow, no. Wyckoff, probably. But in terms of the Transports and Industrials aspects of Dow Theory, it wouldn't matter. Either the two are trending in the same direction or they aren't. Now that the Indies have decidedly joined the Trannies (though the Dow Theorists called it two months ago), we have to go on from there.
 
Dow, no. Wyckoff, probably. But in terms of the Transports and Industrials aspects of Dow Theory, it wouldn't matter. Either the two are trending in the same direction or they aren't. Now that the Indies have decidedly joined the Trannies (though the Dow Theorists called it two months ago), we have to go on from there.

Thanks,
erie
 
Db,
Would Chuck, Dick, Ricky and Jack not be looking at them(Transports) to find s/r first?
erie

I realize that "the averages most confirm" is a commonly used principle, but why not expand your view and look at other indices/sectors too? (I know you do erie, this isn't directed at you or anybody in particular). For example, I think the small-caps already showed potential (relative) weakness 6 months ago.
 
And let's not forget that you pointed out the weakness in the Trannies months ago.

Yes, but so did some important financial papers ( Barron's for instance ). Also if you hadn't point me in the right direction years ago , I wouldn't have learned as much from TA.

erie
 
I realize that "the averages most confirm" is a commonly used principle, but why not expand your view and look at other indices/sectors too? (I know you do erie, this isn't directed at you or anybody in particular). For example, I think the small-caps already showed potential (relative) weakness 6 months ago.

I don't know of anyone other than erie and I who do, but since there's no interest in it, we rarely post it. And then all but a few are mystified when the markets do whatever it is they're doing at a particular moment.

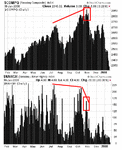
New highs, new lows, volume of advancers and decliners, small caps, mid caps, sectors. They're all a part of it, but they're not exciting. They do, however, provide a certain confidence that many traders seems to lack.
 
As an example, new highs. I used to post this stuff in my journal, which has now, apparently, disappeared. But it's all in the book.

You don't need indicators; you just need to pay attention.
 

Attachments

  • Image7.gif
    Image7.gif
    25.5 KB · Views: 221
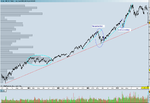
I wonder if this will eventually be judged as the longest bear market rally in history . . .

Db,

would you mind saying a few extra words about this post? I have yet to make sense of what you were saying.

tune
 

Attachments

  • longestbear.gif
    longestbear.gif
    38.6 KB · Views: 221
I don't know of anyone other than erie and I who do, but since there's no interest in it, we rarely post it.

With others likely to think the same, it's reasonable to assume that there are others who do the same but rarely post any charts, tune & myself being amongst those few.

Db,

would you mind saying a few extra words about this post? I have yet to make sense of what you were saying.

tune

It's interesting how zooming out to "the big picture" can give you a different outlook. I think the above statement is better represented in the techs (see chart).
 

Attachments

  • $compx.gif
    $compx.gif
    11.6 KB · Views: 235
Db,

would you mind saying a few extra words about this post? I have yet to make sense of what you were saying.

tune

I was looking at the number of legs. Since the "bull market" was largely manufactured by the Fed and mortage lenders, I was wondering if we'd get three legs. As it is, we only got two (one could argue that there was only one), which suggests a bear market rally.
 
With others likely to think the same, it's reasonable to assume that there are others who do the same but rarely post any charts, tune & myself being amongst those few.

It isn't as though my feelings are hurt. I've begun a number of threads that went nowhere and loads of charts that nobody looked at. One never knows who's going to be interested in what, so you just throw it against the wall and see if it sticks. The charts do take time, though, and there's no point in doing them if nobody's interested.

Now if I loaded them up with indicators . . .
 
dbp

Thank you for your replies yesterday.

I think I do understand what you are saying but I will not prolong the agony by asking further questions.

Regards

bracke
 
It isn't as though my feelings are hurt. I've begun a number of threads that went nowhere and loads of charts that nobody looked at. One never knows who's going to be interested in what, so you just throw it against the wall and see if it sticks. The charts do take time, though, and there's no point in doing them if nobody's interested.

Now if I loaded them up with indicators . . .

Speaking of which, I suppose we'll begin the looking-for-a-bottom process, which will likely be lengthy and put us back into the one-post-a-month mode.
 
I was looking at the number of legs. Since the "bull market" was largely manufactured by the Fed and mortage lenders, I was wondering if we'd get three legs. As it is, we only got two (one could argue that there was only one), which suggests a bear market rally.

I was wondering if you had looked at some of the European indices. The DAX for example shows a chart that I would interpret as a three-legged bull market, with a parabolic rise near the end. Perhaps it depends on how you define the corrections that alternate the legs, but doesn't the remarkable increase in the slope of the TL indicate the final "public is all involved" stage of a bull market?
 

Attachments

  • dax.PNG
    dax.PNG
    54.9 KB · Views: 234
Last edited:
I don't follow the DAX, and whether or not there are three legs is debatable. But I don't see the big volume increase on the upswings, particularly toward the end, that would suggest large-scale involvement by the public. The big volume, in fact, is on the downswings. Nor did I see the usual distribution. Just plain ol' triple tops.

Greenspan began interfering with the normal cycles in '98. Bernanke continues to do so. Therefore, it is especially important to focus on price and volume, momentum, changes in trend and so on rather than "sentiment" or the relationships among small, mid, and largecap stocks or other used-to-be-traditional markers of where we are.

Which is why it pays not to fuss with those basics with which traders can't f**k, such as the relationship between the DJIA and DJTA.
 
Having a "roadmap" of some kind is important in order to establish what phase/trend the market and has helped me understand why price moves in the manner that it does. I realize I must therefore reconsider my position if the market shows me otherwise. Your comment about this being a bear market rally puts a lot of what I considered as clear, in doubt. I would therefore appreciate it if you could shed some light on how one could distinguish the one from the other.

I don't follow the DAX, and whether or not there are three legs is debatable. But I don't see the big volume increase on the upswings, particularly toward the end, that would suggest large-scale involvement by the public. The big volume, in fact, is on the downswings.
I was merely thinking about how the last 5 years pan out on a different index. It just happens to be the DAX, because that's the only "major" index I keep an eye on, which still looks like it's in an uptrend. Next to that, the "corrections" (if that's what they are), are easier to distinguish than in the US indices.

Back to the (attached) DJIA I still see three similar uplegs, with a prolonged period of sideways movement going on in between the first and second. I believe you called this a "time correction" somewhere. The third upleg has the typical parabolic rise, after which volatility increased and the daily range expanded. Aren't these elements which one would expect to see in a distribution phase?

Nor did I see the usual distribution. Just plain ol' triple tops.
With "usual", are you refering to time that it takes to complete a distribution phase? I thought a multiple top was an important reversal signal.

Greenspan began interfering with the normal cycles in '98. Bernanke continues to do so. Therefore, it is especially important to focus on price and volume, momentum, changes in trend and so on rather than "sentiment" or the relationships among small, mid, and largecap stocks or other used-to-be-traditional markers of where we are.
Isn't the change in the slope of each consecutive up-leg a reflection of the increased momentum that occurs while a bull market progresses?

Which is why it pays not to fuss with those basics with which traders can't f**k, such as the relationship between the DJIA and DJTA.

I understand these are the foundations to look for conformation (or absence of ~), but what if one were to trade silver, gold, or any other commodity?
 
Having a "roadmap" of some kind is important in order to establish what phase/trend the market and has helped me understand why price moves in the manner that it does. I realize I must therefore reconsider my position if the market shows me otherwise. Your comment about this being a bear market rally puts a lot of what I considered as clear, in doubt. I would therefore appreciate it if you could shed some light on how one could distinguish the one from the other.

I did not say that this was a bear market rally. I said that two legs suggest a bear market rally. As for the difference between a bull market and a bear market rally, this has to do with the number of legs, the slope, and the amount of time involved, among other things. Most investor dictionaries or encyclopedias will provide all the details.

I was merely thinking about how the last 5 years pan out on a different index. It just happens to be the DAX, because that's the only "major" index I keep an eye on, which still looks like it's in an uptrend. Next to that, the "corrections" (if that's what they are), are easier to distinguish than in the US indices.

Back to the (attached) DJIA I still see three similar uplegs, with a prolonged period of sideways movement going on in between the first and second. I believe you called this a "time correction" somewhere. The third upleg has the typical parabolic rise, after which volatility increased and the daily range expanded. Aren't these elements which one would expect to see in a distribution phase?

The volume's not right. But the index made a triple top anyway, suggesting that the distribution took place; it was just extraordinarily sloppy. This sloppiness may have something to do with the speed and extent of the decline.


With "usual", are you refering to time that it takes to complete a distribution phase? I thought a multiple top was an important reversal signal.

See above.


Isn't the change in the slope of each consecutive up-leg a reflection of the increased momentum that occurs while a bull market progresses?

Yes, but, again, the volume hasn't been consistent with this scenario. Therefore, one has to turn to other basics, such as new highs and volume of advancers.

I understand these are the foundations to look for conformation (or absence of ~), but what if one were to trade silver, gold, or any other commodity?

I don't trade commodities, so I can't help you there. But tangibles follow different rules than intangibles. I'm sure that the commodity threads have loads of information.

A map is indeed important. However, when markets are manipulated and not allowed to follow their natural cycles, drawing an accurate map becomes increasingly difficult (like mapping the staircases at Hogwarts). Even Justin Mamis has complained that the market no longer makes any sense.

Therefore, when any of the touchstones that one has used to judge what the market is doing and where we are in it no longer work very well or at all, one must get past it and focus on those criteria which are next to impossible to sidestep, such as new highs. That along with trend change and trend reversal and violations of successive levels of support will provide better guides.

At bottom, one has to look past lines and patterns and so forth and focus on what traders are doing. The most important message sent via the second and third tops was "No Demand".
 
Back
Top