Candlesticks not profitable Massey University Research

Do Candlesticks work or not?


  • Total voters
    135
Yes - the body and wick represent prices at specific points in time during the time interval the candle covers. The same applies with the structure of a bar.

As I specified on another thread I would recommend, as an exercise, that price is followed in real time (at least from time to time). During the interval of creation of a candle/bar the observer will experience how/if it gradually/suddenly elongates from the opening price. The observer will also observe the acceleration and deceleration of the elongation or the moving of the current price between the high/low or see it create a new high/low.

Furthermore if this is accompanied by observing the level 2 screen the movement and volume of orders can be compared to the candle/bar formation in real-time and the price at which trades take place. Again an examination of the acceleration/deceleration/resting activity times can be very illuminating

In this fashion the "story" contained within the static completed candle/bar can be better interpreted.

Charlton

I understand. So in conjunction with what Socrates has been saying, would I be right in concluding that Candlesticks are nothing but an adjunct?
 
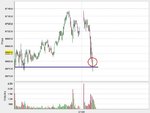
Why not post some examples of candlesticks and how you use them in your trading or how one could use them ... I'll start with an example of my own, from yesterday's YM trading.
A breath of fresh air. Thanks firewalker, best post I've seen today!
 
I understand. So in conjunction with what Socrates has been saying, would I be right in concluding that Candlesticks are nothing but an adjunct?
new_trader

I would not use that word myself, because it sounds like they are an aside with no value. I would say that candlesticks/bars are a source of information in your toolbox. A trader needs to know how to use them (if they choose to do so) and what their limitations may be. There are other sources of information that can add value to them, but not everyone has access to these due to monetary, time or other constraints.

You need to evaluate what suits you and all your personal circumstances, but base it on as much personal research and observation as possible. Question everything you read or are told and ask does this stack up with your personal observation.

Sometimes, perhaps often, candlesticks/bars may, as Socs said earlier, be evaluated in standard textbook fashion. When they do not conform ask yourself why and re-evaluate your view on how they should be used.

Charlton
 
socrates

I can't do this via pm because you have it turned off.

Will you please note that any references on your part to the PL etc are now regarded as advertising. Thus, I must warn you that you will be banned should you persist.


Similarly, you continue to disrupt threads by attacking other members - either directly or indirectly - and I must warn you that you will be banned should you persist.

jon
 
Since the choke chain has been applied, I'll step out there and provide an example of when and why a "hammer" provides a useful signal (which is not to say that the hammer "works"; it's the trader who works, not the hammer).

In this case, the candle provides a good signal because it occurs at support which extends back to the beginning of May. It does not simply occur in midair.

attachment.php


Enter above the "hammer", stop below.

.
 

Attachments

  • Image100.gif
    Image100.gif
    13.3 KB · Views: 1,258
Since the choke chain has been applied, I'll step out there and provide an example of when and why a "hammer" provides a useful signal (which is not to say that the hammer "works"; it's the trader who works, not the hammer).

In this case, the candle provides a good signal because it occurs at support which extends back to the beginning of May. It does not simply occur in midair.

The volume on the hammer and the trading activity surrounding the hammer make it a strong hammer imo. There's a sudden increase as price approaches support level and on the hammer itself volume peaks as if buyers wanted to say "look, we are still here". Then on the next bar things return back to normal and price starts to rise, so it looks like sellers were flushed out.

I don't know the classic "rules" for trading hammers, but I think your example is close to a 'perfect' hammer as per candlestick textbooks: long lower shadow, short or no upper shadow... but more importantly I think what matters is that it occurs after a wave of selling, on a significant support level and on increased volume.

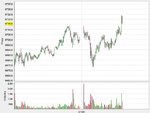
Pretty much the same thing happened today, and at the same place, though this time with a retest (a la Wyckoff). Of course, having someone ring the bell and tell everyone what to do NOW when price first tested support would be nice, but even nicer is knowing what to do ahead of time. 🙂

Db
 
Pretty much the same thing happened today, and at the same place, though this time with a retest (a la Wyckoff). Of course, having someone ring the bell and tell everyone what to do NOW when price first tested support would be nice, but even nicer is knowing what to do ahead of time. 🙂

Db

Funny, I was actually going to post that chart. If I'm correct you are refering to the high volume hammer candle around 1945.00 (on my 5-min chart). I reconsidered then because I thought it wasn't the perfect example. Or at least not as perfect as your previous post 🙂

Talking about Wyckoff there was a nice springboard today on DOW, but that belongs in another thread.

Doesn't have to be perfect. That's the difference with RT trading. You see it, you buy it, you place your stop. If you're wrong, or, if you prefer, you're not proven right, you get out, and watch, and wait. You then see a "lower low" on lighter volume and take that.

It's not rocket science, as you know, just plain vanilla PV. 🙂

As for springboards, I'm not going there again, except in the group.😉
 
The Massey University Finance Dept. carried out research by Ben R. Marshall, Martin R. Young and Lawrence C. Rose, Dept. of Finance established from their research that candlesticks do not work and are not profitable, this research was released 16 April 2007 ... http://ssrn.com/abstract=980583
A 1998 paper concluded: "The out-of-sample tests on two distinct sets of data provide a very high degree of certainty that the three-day patterns in candlestick analysis have predictive value. To the best of our knwowledge this is the first time a scientific test has shown statistical validity of any price pattern.". The paper is The Predictive Power of Price Patterns, Caginalp and Laurent, Mathematics Department, University of Pittsburgh, 1998. I havent read it or the Massey Univ. paper.
 
A 1998 paper concluded: "The out-of-sample tests on two distinct sets of data provide a very high degree of certainty that the three-day patterns in candlestick analysis have predictive value. To the best of our knwowledge this is the first time a scientific test has shown statistical validity of any price pattern.". The paper is The Predictive Power of Price Patterns, Caginalp and Laurent, Mathematics Department, University of Pittsburgh, 1998. I havent read it or the Massey Univ. paper.

you can find that paper in one of my posts on the first page

http://www.trade2win.com/boards/showpost.php?p=336606&postcount=12
 
in the paper the author's used statistical methods, and therein lies the main objections to it. Darksidders don't bother with statistics.

Generally speaking people use statistical tests because the system under scrutiny is too complex to model explicitely. It's a poor short cut in a way, and to many problems it's the only short cut. Other times its used to test a simple hyphothesis, and that is where the confidence interval on large sample data is used. These simple hypothesis are usually of an explicit simple nature and the confidence interval is to allow for "errors" in the experiment, a kind of noise filtering as it were.
 
It´s emotion that moves the market. If the pattern did not create enough fear of losses (or even fear of not winning sometimes) then it probably wont start a larger move. So it depends on the bigger picture as i see it. For it to go down fast enough traders must have bought and be ready to stop out. Right?
 
Last edited:
Another strong hammer on support

A very nice entry on FTSE just now.
 

Attachments

  • ftse_long.jpg
    ftse_long.jpg
    35.5 KB · Views: 273
Depends on the market. In forex, there are billions or sometimes trillions of dollars moved every day for reasons quite unrelated ti investment decisions (e.g. an airline buys an airliner and has to pay for it - due date comes, and they have to do the transaction. It doesn't matter if they think they can do the transaction at a better rate if they wait a bit - the money's due now.

Simplistic I know (for all sorts of reasons) but just wanted to make the point that by no means all transactions in the financial markets are people trading their own book, subject to the fear and greed you talked about.

GJ

Is that the way you think an airline would conduct business? I am no expert on forex, but I purchased an investment property overseas and the price was in Euro's. The next day I took out a CFD in Euro/Pound to hedge my purchase against fluctuations in the currency. That way I wouldn't end up paying more than I had accounted for if the Euro suddenly skyrocketed in the month or so it took to settle the purchase and make the final payment.
 
This is a very stupid research --- The Premise of the Title itself is senseless.

No signal from a Bar Chart, Line chart or Candlestick Chart creates any profit for anyone. These charts are only guides telling you where the market has been a few seconds, minutes, hours or weeks ago. Your interpretation of the signals dictates your next step, whether to enter the market or exit.

Compared to all the other charts, candlestick charts are the most accurate. In fact, in my experience of using Candlestick charts for the past 5 years, the accuracy rate has been 100%. The few mistakes I have made using these charts were due to my erroneous interpretation of the signals. Most Traders do not know how to interpret Candlestick signals and hence, when they screw up, they blame the Charts instead of themselves.

These aside, it's not how good you are at interpreting candlestick charts correctly that makes you money or creates profit for you. Rather, your effective and efficient combining of every aspect of trading; self-management, money management, risk management, discipline and portfolio management (which includes timing using candlestick signals) creates profit for you.

These university professors or researchers should have used their research funds for actual trading, rather than wasting it the way they did. In fact, they should have gone to Las Vegas to gamble with the money and have some fun at the same time because what they did is just worthless.

No signal or analytical tool can create a profit for you, be it MACD, fibonacci, RSD or yada, yada. The simultaneous culmination of every aspect of trading as mentioned earlier is the only way for a Trader to make a profit.
 
Back
Top