firewalker99
Legendary member
- Messages
- 6,655
- Likes
- 613
Mr_Nasdaq said:Areas of Gathering Resistance serve as pivotal areas on a chart; they are areas where the price of a rising stock will invariably pause before deciding what direction to take next.
Tuesday's 5-Minute Chart demonstrates how vital it is for traders to know the exact location of areas of Gathering Resistance.
A short position established within Monday's 8-cent area of Gathering Resistance yeided an impressive profit on Tuesday:
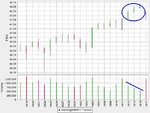
Hi Mr Nasdad, I was wondering if you look at the "big picture" too, a chart with daily bars for instance, showed a small trading range doji-like bar, which was the third in a row of declining ranges with each lower volume. These were all indicators (imo) that we were at the top of a range and ready to fall back a bit...