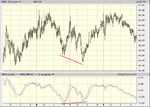
Buy at Support - Sell at Resistance

The QLD

Actually I use Slow Stochastics but it is only a personal preference.

Just to point out that while the QQQQ has more liquidity at ave volume of 112 million the pretty new ETF - QLD with 281k is enough for traders. This ETF gives twice the performance of the QQQQ.

Obviously the better leveraged trade is using futures but for those who cannot they can use the QLD.
Yesterday the QQQ gave a minor gain of 1.76% and (ran back to resistance)

qqqq25.png


The QLD does not yet have much history but notice the percentage gain at 3.69% - more then twice that of the QQQQ. So if one uses the Qs now as a hedge or a trade consider the advantage to the QLD if you wish more leverage.

qld25.png
 
QQQQ and Tuesday's area of "Gathering Resistance"...

The QQQQ printed another new high for its Summer Rally on Tuesday when it rose to $40.80.

$40.80 was the front door of Tuesday's narrow band of Gathering Resistance between $40.80 and $40.82. Resistance was found and the QQQQ fell to a subsequent low of $40.40.

Tuesday's 5-Minute Chart shows the QQQQ rising to Gathering Resistance, pulling back $0.40, then, recovering in the afternoon:

Chart5Min65QQQQb.PNG


For Wednesday, the QQQQ is poised for a second challenge of Tuesday's area of Gathering Resistance between $40.80 - $40.82.

If that Resistance is captured, there is another substantial area of Gathering Resistance between $40.96 and $41.06.

As for the decent into the October Low ... it could begin at any moment from current lofty levels ... if not this week, then, likely, next week, after end of quarter "window dressing" is finished.
 
As the QQQQ goes so goes the rest of Technology...

StockTiger said:
I know a few that use the Qs as hedges but wonder if you trade them.
StockTiger,

I trade the QQQQ based on areas of Gathering Support and Gathering Resistance as highlighted in my 5-Minute Charts.

I also trade other tech stocks based on whether the QQQQ is reversing up from Gathering Support or reversing down from Gathering Resistance.

As the QQQQ goes, so goes the rest of Technology. Therefore, I keep a close eye on the QQQQ.

If the QQQQ is reversing up from Gathering Support, I avoid short positions in other Tech Stocks.

Likewise, if the QQQQ is reversing down from Gathering Resistance, I avoid long positions in other Tech Stocks.

The advantage goes to the trader who does not swim against the large current of the QQQQ.

P.S. - I appreciate your last chart (Crude Oil - $WTIC) in that it shows how long-term Support at the Fibonnaci 38% Retrace coincides with intermediate-term Support at the February, 2006 Low.

That's what I call an area of Gathering Support (a "Gathering" of individual aspects of Support within a narrow price range that, by their gathering, form an area of industrial strength Support).

$WTIC Chart and Comments:
http://www.trade2win.com/boards/showpost.php?p=277920&postcount=2

Mike Winfree (Mr Nasdaq)
 
Last edited:
Naz 100- S%P

The Naz 100 had been beating the S&P 500 since the low when the buy signals were given. Now on the ratio chart you see that MACD has negative divergence. The RSI tagged 70 the stochastics dropped below 80 so a fall is near. Still a couple more days they will try to dress up portfolios but if you are long then tight trailing stops are a fine way to exit. In general you want to be long the Naz 100 compared to S&P when the MACD red line is below the blue.

sc
 
Last edited:
QQQQ - Thursday's Observations...

The QQQQ demonstrated on Thursday that it's more than willing to glide ever so gently, on light volume, into the close of the 3rd Quarter.

Thursday's 5-Minute Chart shows the QQQQ displaying little interest in challenging either Gathering Resistance above or Gathering Support below:

Chart5Min67QQQQb.PNG


On Friday, the QQQQ may deliver similar action to that of Thursday. Fund managers, desiring to preserve every penny of the Summer Rally for their 3rd Quarter Reports to shareholders, will postpone any serious profit taking until next week.

A substantial area of Gathering Resistance lies between $41.00 and $41.06 going into Friday's trade.

A second area of Gathering Resistance lies between $41.17 and $41.23.
 
B bands

This type of short term trading is also trading between the bands.

Using Bollinger bands and watching for the candles to break above or below the bands often signals a reversal. Sometimes it can walk up or down the bands but using RSI can help tell you .

qqqband.png
 
Bollinger Bands...

StockTiger,

Bollinger Bands are, indeed, important and commonly used aspects of Support and Resistance.

They were developed by John Bollinger, the Technical Analyst who appears regularly on CNBC.

I use Bollinger Bands from three time periods in determining the location of Gathering Support (Buy Triggers) and Gathering Resistance (Sell Triggers).

For example, in the chart below, the areas of Gathering Resistance for both Wednesday and Thursday include 2 Bollinger Bands, one from the Daily Chart and one from the Weekly Chart.

I also use Bollinger Bands from the Monthly Chart in my work.

For more information on Bollinger Bands, click on the following StockCharts.com link:
http://stockcharts.com/education/IndicatorAnalysis/indic_Bbands.html


Chart5Min67QQQQb.PNG
 
Rsi

With the new QLD - other then liquidity I do not know why someone would trade the Qs much anymore but this can be used for any stock.

You mention gathering ares that some call zones or ranges. Those are pretty vague and as they are so fluid since as a resistance is broken if becomes support and can build more so in time.
To help benefit the very short term day trader then the vagueness does little but coupled with indicators like B bands other timing indicators can be used.

Here on the 5-min chart we have stochastics at 5, 3 and RSI 9

When the RSI crosses from under 30 to above 30 while stochastics at that time crosses from under 20 to above 20 it is a high probability buy.

When the RSI goes from above 70 to under it while stochastics goes from over 80 to under it then it is a sell.

Of course if these worked 100% of the time we would all be at the beach and let our computers do the trading but the use of these 3 together is much clearer and often more precise as to when to buy or sell - not only a "gathering place". And in day trading one wants to get in and out as close to turning points as they can.
On the chart you show everyone was waiting on Sept 12 for it to reach the gathering point at $40.24 but on this chart the strong buy was given at $40.45.
Nothing is perfect but getting away from the vague areas of support or resistance and closer to the accurate and active turning points is the aim.

qq230.png
 
Right

Yes dbphoenix - MACD positive divergence is also a good indicator of the future. It is often though not a good timing indicator as many times you can have positive divergence for quite a long time before a stock moves on it.

In the illustration you posted it worked on time - thanks
 
StockTiger said:
Yes dbphoenix - MACD positive divergence is also a good indicator of the future. It is often though not a good timing indicator as many times you can have positive divergence for quite a long time before a stock moves on it.

In the illustration you posted it worked on time - thanks

Which is where S/R come into it. A "divergence" in and of itself is often meaningless, much less a cross of one line over another.

There are also matters of trend and entry. If one is trading counter-trend, he has to be extra careful, and if he's trying to catch a reversal, then he probably is. And if he's trying to catch the bottom, he is likely to have more difficulty than if he places his entry trigger above price rather than at or below, i.e., he puts the market into the position of stopping him into the trade rather than taking a stab at the dark and hoping for the best.

In other words, locating S/R is relatively simple. The more difficult part is "then what?".

Db
 
Gathering Support and Gathering Resistance...

StockTiger said:
You mention gathering ares that some call zones or ranges. Those are pretty vague...
StockTiger,

Areas of Gathering Support and Gathering Resistance are ordinarily narrow in range. That makes them specific in nature and not "vague" as you suggest.

I post my 5-Minute Charts because they clearly demonstrate the effect that Gathering Support and Gathering Resistance have on the price action of a stock.

Thanks for mentioning RSI and Stochastics. They are valuable indicators of "overbought" and "oversold" conditions and of impending changes in trend.

As such, they can be used as confirmations that it is, indeed, time to venture a purchase at an area of Gathering Support or a short sale at an area of Gathering Resistance.

For more information on "RSI" and "Stochastics", click on the following StockCharts.com web sites:

RSI
http://stockcharts.com/education/IndicatorAnalysis/indic_RSI.html

Stochastics
http://stockcharts.com/education/IndicatorAnalysis/indic_stochasticOscillator.html

For more information on the MACD Indicator, mentioned by dbphoenix in his previous posts...
http://stockcharts.com/education/IndicatorAnalysis/indic_MACD1.html
 
Last edited:
How to Limit the Damage of a Losing Trade...

The following 3 steps explain how to limit the damage of a losing trade:

1) Accept without reservation the reality that "No matter how good a trade looks, it can turn into a loser".


2) Predefine the risk of EVERY trade by establishing a maximum amount that you are willing to lose on it.

3) Honor your predefined risk when it is reached. Do not rationalize, hesitate, justify or hope. Close the trade. There is always another trade just around the corner.

These three steps will help you avoid the common trading error of letting a small loss turn into a big loss.

They will preserve your capital and enable you to return to trade another day.
 
or

another way to put S/R is Diminishing Support and Diminishing Resistance.

I actually do not trade the Qs but the Dow futures. Sometimes on at the 2:30 move or morning news to a quick 10-20 points but more often when support is broken down or resistance broken up. If it is quite oversold and at support I buy right there as a mistake costs little, buying as close as possible to support (or what was former resistance) limits your downside as you exit if it goes the wrong way.

I use a 5-min chart during an open trade but a 15-min chart for determining longer hold trades

on this live chart the trend line (which is below the 50-period EMA) is now support - not gathering nor actually diminishing but - support. If it is broken the odds are high for a move to the 200-period and support 40 points below. By shorting exactly on a break (or a rally back to it if missed) then the risk is small as stops are then just above.
Obviously this example today is not a perfect setup as stochastics are already in oversold territory but still a valid one. A much better set up was Sept 24-25 when Actual Support was being tested and stochastics we oversold - that was a very high odds buy and they come around a few times a month.
If in this example the support holds and stochastics goes back above 20 then it can be a buy with the stop just under the support.

One of the nicest things about trading the e-minis is if you buy near support (or sell on a break) and the trade goes the wrong way you can almost always in the same day get another setup to correct the earlier loss and turn it to a gain.

We can see look at this chart Monday and see which way it decides..It closed at support at 11679.
Have a fun weekend!

sc
 
QQQQ - Monday's 5-Minute Chart...

The QQQQ was hit on Monday with Round #1 of pent-up profit-taking.

Monday's 5-Minute Chart shows how the QQQQ related to 3 separate areas of "Gathering Support":

Chart5Min69QQQQb.PNG


On Tuesday, the QQQQ is poised to challenge an area of "Gathering Support" between $39.90 and $39.97.

It's an important area of "Gathering Support" for two reasons:

1) One of its members is the still steeply rising "20-Day Moving Average". That line has served as Support since the mid-August Low. As long as Support continues at that line, it will be impossible for the bears to declare the end of the Summer Rally.

2) A second member of Tuesday's area of "Gathering Support" is the "200-Day Moving Average". A "200-Day Moving Average" is often viewed as the dividing line between a bull market and a bear market. As long as Support continues at that line, it will be impossible for the bears to declare a meaningful victory.

On the other hand, if Tuesday's "Major League" area of "Gathering Support" is violated (by a decisive close below it), it will be viewed by many fund managers as a reason to do more profit-taking.

ChartDaily04QQQQ.PNG
 
Q

Yes the Qs closed right at support, near the trend line and the 38% retrace. Maybe a bit more dip before a rally.

The convergence of the 50 and 200-day EMAs likely meads there will be a pretty big move ahead. - Stochastics have again dipped under 80.

sc
 
QQQQ - Tuesday's "Gathering Support" Update...

Mr_Nasdaq said:
On Tuesday, the QQQQ is poised to challenge an area of "Gathering Support" between $39.90 and $39.97.
Tuesday's 5-Minute Chart shows that the QQQQ delivered a nice bounce from Tuesday's area of Gathering Support (Buy Trigger) between $39.90 and $39.97.

Traders are taking profits, however, at Resistance at the "200-Period Moving Average".

Moving Averages are "natural" places at which to take profits, especially when they are declining as is the "200-Period Moving Average" (the thin red line on the chart below):

Chart5Min70QQQQc.PNG
 
Actually

If you look at the lower live chart yo will see that the bounce was at the Hard Trend line - no questionable area
 
QQQQ - Tuesday's 5-Minute Chart...

The QQQQ opened on a weak note and fell into Tuesday's area of "Gathering Support" between $39.90 and $39.97. After printing a low of $39.88, Support was found. The QQQQ rallied 60 cents to a subsequent high of $40.48, pulled back a bit, then spent the rest of the day in a narrow trading range.

Tuesday's 5-Minute Chart shows the rally from "Gathering Support". Notice how traders began to take profits at Resistance at the "200-Period Moving Average". A Moving Average is a "natural" place at which to take profits. That's especially true if the Moving Average is declining, as was the "200-Period Moving Average":

Chart5Min70QQQQb.PNG


On Wednesday, if the QQQQ is to rally further, its first task will be to capture Resistance at the "200-Period Moving Average" mentioned above. That average stands at $40.43 going into Wednesday's trade. It's followed by an area of "Gathering Resistance" at $40.65 on the nose.

It must be noted, however, that both the CCI and MACD Indicators that are attached to the Daily Chart issued "Sell" Signals on Monday and continued deeper into "Sell" Signal territory on Tuesday.

Tuesday's rally in the face of two "Sell" Signals is a "divergence" that makes Tuesday's rally suspect.
 
Top