Build Neural Network Indicator in MT4 using Neuroshell

Hi Kryzs,

I think it is good if you can show one of your trading strategy sample result (in forex or others), how you integrate your data feeder, training and walk forward test result, Monte Carlo test..etc.
1. Regarding data feeding, are you using realtime ASCII file transfer to feed your MC or manual transfer, which forexite data you are using, do you need additional software to transfer them.
2. Training and optimization, how long it takes?
3. Can you show us the sample pictures of those process? for example any steps that required, so I can easily to see your results.

Thank you & regards,
Arryex
How long you do the optimization, is it realtime data?

example of Walk Forward report and Strategy Report for MC. Please change the extension from .txt to .rar and open with winrar. Seem to be not possible to attach rar file
 

Attachments

  • example.txt
    592.4 KB · Views: 838
Last edited:
It seems to me that the tools you use to build and test a system depend a lot on the stage of development. MT4 and an NS2 generated DLL should be adequate to simply try to test the robustness of a NN. But I'm not sure just what that means as explained below.

Regarding the slow speed of testing with MT4, I think this can be overcome using a DLL. e.g. a DLL to compute the Corona spectral indicators might speed things up a lot. The Net that Arryex uses would probably run very slowly if implemented in MLQ code. You can even multi thread the DLL if necessary.

It may be desireable to use other apps to make additional tests after the system has been developed and tweaked using MT4. And you may very well want to use a more rigorous test bed including MC, etc before you trade live. Krzysztof rightly points out some advantages of MC, MSA and the Grail.

But I have had enough talk of the tools. Each of us can select our own (the discussion so far has been very helpful in this regard). What about the concept? Does this EA backtest really verify that there are useful patterns in multiple markets? Do the patterns change with time? What is the best way to exploit the patterns if they exist? I am afraid that tests that use an EA may hide the true value, because they depend as much on the testing platform and the trading system as on the indicator.

I am initially concerned with two things:
1. How accurate are the predictions? (The mse is not a sufficient measure for me).

Suppose, for example that you could predict the next bar high and low perfectly. Then you could write an EA that entered at one extreme and exited at the other. A Holy Grail system!

But there are no such thing as perfect predictors. The question is, how large are the errors, and how are they distributed. e.g. if the 90% confidence intervals on the high and low predictions do not overlap for some set of values of predicted range, then one should be able to develop a trading system with controlled risk/reward ratio and controlled average gain per trade. There is no need for immediate testing with an EA, or for optimization. Such testing may easily hide the value of the prediction.

We do not need to rely on a difficult to program and understand platform for testing the error distribution. An Excel spread sheet will do the trick. However, we do need many predictions. I will volunteer to do the error measurements if Arryex will supply a file of at least 10000 predictions, or provide an indicator that can be used to make the predictions.

2. Are the errors stationary?
If the errors are not stationary, then it may be necessary to retrain the net periodically, or to use some form of adaption. This too can be measured with a spread sheet. If the mean and variance of the errors do not change with time or duration, then the errors are stationary enough. I know, I know, this is not the best, or even a complete test of stationarity, but it is good enough test to decide whether the Nets must be periodically retrained. I will also volunteer to make these measurements, because they are simple enough for me to grasp. We can all agree on what they mean. The performance of an EA is so dependent on the details of the EA that we probably would all disagree on what it meant.

Of course I would much prefer that you (Arryex) make the measurements, but if you are too busy, or not interested, then please post a file of the predicitions, or the indicator to make them.

Regards
Fralo...MadCow elsewhere.

Yes if the Arry can provide sufficient number of predictions than we can measure the error and dont need any specialized test bed. But i think Arry just made one or maybe a few Walk Forward runs with not so many trades and in order to measure quality of prediction we need much more data.

Krzysztof
 
Yes if the Arry can provide sufficient number of predictions than we can measure the error and dont need any specialized test bed. But i think Arry just made one or maybe a few Walk Forward runs with not so many trades and in order to measure quality of prediction we need much more data.

Krzysztof
Hi K...
But if Arryex has a DLL based indicator that runs in MT4 he should be able to make predictions back to the beginning of his data. Usually that's 1999. At H1 or even H4 that should be more than 10000 predictions of next bar high and next bar low. That's quite a few. All he needs to do is put a print statement in the indicator and post the log, or modify the DLL to print to file.

Some of the data was used to train the network, and that data should be avoided when measuring th errors, unless the net was trained on one TF and will be run on another. So with that caveat there should be the possibility of many predictions.
MadCow
 
Last edited:
Hi Guys,

Sorry I far from my home PC where all my data are stored, it may possible to to show it after next 2 weeks.

By the way for your information, the walk forward test is using in H4 time frame from year 2006- 2010, my training data is using 15M from 1999 (about 2500 bars).

Kryzs, I opened the file after converting txt to rar, I found 2 files WS.xlsx and GBP A0-FX Back Test.xls. I could not open GBP A0-FX Back Test.xls using Office2007, should I change the file extension?

Thank you
Arryex

I just tried and Excel 2007 opens it without any problem, just complains about different format but opens. Anyway, I enclose once more in zip format.

my training data is using 15M from 1999 (about 2500 bars).

By this you mean in sample or out of sample ?? If it was out of sample what was the result of this ?? Can you post a report ??


Krzysztof
 

Attachments

  • GBP A0-FX Back-Testing Strategy Performance Report.zip
    550.9 KB · Views: 612
Hi Arryex,

Thanks for starting the thread. I hope it stays on-topic as "Build Neural Network Indicator in MT4 using Neuroshell" rather than drifting or being pulled to other products.

I like your use of NS2 for laying the groundwork. I believe that ChaosHunter, also by Ward Systems, takes that "up a notch", producing code which imports into NSDT. ChaosHunter now takes advantage of not only multicore cpus, but also (amazingly to me) can use idle multicore cpus on the network. I hope they bring this technology into the next version of NSDT.

I believe it's also important to incorporate multiple timeframes into the matrix as this will minimize 'bad' trades and drawdown as well as giving a better indication as to when should let a good trade run. I think a TS of 15 pips leaves too much on the table, and that *any* TS decision needs to be dynamic rather than just picking a number for all situations.

Thanks again, and keep up the good research and PDF publishing :)
 
Hi K...
But if Arryex has a DLL based indicator that runs in MT4 he should be able to make predictions back to the beginning of his data. Usually that's 1999. At H1 or even H4 that should be more than 10000 predictions of next bar high and next bar low. That's quite a few. All he needs to do is put a print statement in the indicator and post the log, or modify the DLL to print to file.

Some of the data was used to train the network, and that data should be avoided when measuring th errors, unless the net was trained on one TF and will be run on another. So with that caveat there should be the possibility of many predictions.
MadCow

Hi,

I think the main problem here is that NS2 produces C code of trained network. Than this network needs periodical retraining and reoptimization so a new code. Than it is very difficult to say what is optimal training range, optimal out of sample period and how frequent to reoptimize/retrain the net.

The analysis of errors of prediction maybe can answer those questions but i bet that
errors will be not stationary so to find those answers will be difficult.

So only known method for me is to use Walk Forward cluster analysis like in Grial.
But if anybody knows other methods to answer questions from above please share it.

Krzysztof

Clearly I misunderstood. I thought that Arry trained a network, made a DLL, and then used the network with no retraining. Somewhere he talks about training the network on one TF and then using it on a different TF. I did not know that his DLL needed retraining.

I find it hard to understand how he got the MT4 strategy tester to do the retraining while testing, but I guess it can be done.:confused:
MadCow
 
Hi,

I am sorry if make confusing..

As attached file on #28, the first chart just to show the indicator on H1. With the same dll file from trained NN (data 15M) I apply the EA on H1 chart, it works without any crash MT4 issue as shown in the previous attachment.

Afterward I tested the EA on the 4H chart, including the expert properties and the test result.

Let me explain how it can works in any time frame:
- The inputs and outputs NN collected using MT4 (I use directly using an indicator or the script), the time frame used as the input use parameter 0 then it can be applied for any time frame. Example: iMACD(NULL,0,12,26,9,PRICE_CLOSE,MODE_MAIN,0), the parameter (0) after NULL is applicable for any time frame.
- Train the NN and get the dll
- Call the dll of trained NN by creating the MT4 indicator to shown the output NN (as predicted values).
- As the parameter inputs that I used to train the network and to firing the net using 0 parameter (which is applicable for any time frame).
Hence after creating the dll, I can call the dll for my indicator in any time frame.

To answer Krzys question, the result is out of sample result, because I train the network using 15M chart on year 1999 and the EA test result on H4 time frame since year 2006. Is it a beauty of the NN indicator or not, seems quite useful.

I checked the drawdown is happened when the market is not trending. My next objective is to make a filter, i.e. not to trade whenever the yellow indicator (the 3rd output NN) is on flat/non trending. I am still trying to find it either using Kohonen or PNN.

Cheers,
Arryex

I think we can have the case of future leak here if the periods of training and backtest are overlapping - simply those results are too good to be true.

I know about the theory that if you use factor of 5 in recalculating of TF (so e.g. 5 - 25 min) those 2 TFs suppouse to be not correlated so you can make trick like you did i.e.
train on 15M TF and backtest on higher so minimum 1H 15M but i believe training period and test period can not overlap if you want to consider this as an 'out of sample'.

Simple if you think from DSP point of view and signal information extraction (this what NN does) those TFs for the same period contain the same signal information, just sampling frequency is different.

Krzysztof
 
I've got to agree with Krzys. If you use data during some interval, then any data in that interval, no matter the time frame, should be considered in-sample. If the net was trained using 1999-2009 TF H4, then results during that period should be very carefully evaluated, no matter the TF used. To reduce this problem, you might train using M15 data, say from 1999-2001, and then test using any TF after 2001. The results should tell you whether there's a future leak with your current DLL.

Good luck on predicting a ranging market. If you can do that (out of sample) then almost any MA cross will do very well.
MadCow
 
Hi Guys,

Please find here attached OHLC data, you try to count how many data of 15M bar just from 1999.10.01 01:15 up to 1999.11.30 23:45 using my data exporter it consist of 2081 rows of data.

You can conclude it for yourself.

Regards,
Arryex
 

Attachments

  • EURUSD15M.csv
    94.7 KB · Views: 586
OK, so understand that it is training data and there is no overlap with out of sample data. Than of course all your inputs have this date range ??

Than i dont understand why you didnt run EA from 2000 till now but from 2006. It should not be overlap in this case and we would get more trades so more statistically significant result.

Krzysztof
 
Hi Krzys,

I tried to to optimize the trade with MSA, seems I need to make my EA to generate a trading data as MSA format. Please provide your sample input data for your MSA optimization.

I have seen the previous file WF.xlsx, but I could not see for example the trading Lots, stop loss, take profit, input indicator parameters (on MT4 we can optimize some of them).

I wish to optimize the EA parameter with MSA, if possible.

Thank you,
Arryex
 
Here you have an example of trade file and also function for TS which writes those trades in MSA compatibile format. Than you have to make something similar for MT4 if you want to use MT4, i think MSA accepts a lot of formats so maybe you will find something ready for MT4.

If you scroll WF report right at the end you will see the settings. I think it does not show a lot size, its set in properties of the strategy and not printed.

Krzysztof
 

Attachments

  • FisherPriceRSI_10_3.00_-3.00_10_10_10000_0.txt
    1.2 KB · Views: 622
  • WRITETRADES32.txt
    4.7 KB · Views: 937
Arry..
This is way too complicated for me. You trained on 1999 data and tested on !1999 data. TF's don't really matter, except that a system that works on many TF's should be more robust than a single TF system. So all the tests are out of sample.(y)

But you tested an EA, and you had several parameters of the EA that are not really related to the network, so you optimized these in some way, or maybe not, since I'm not sure what you tested and optimized, or what Kryzs wants to optimize with other software. Perhaps I could find out by reviewing previous posts, but I've done that with little success. My problem is that the network performance and the EA parameters are all mixed together in the test/optimize mode. If you leave them mixed together, you may inadvertently limit the power of the EA, or even decide that the network is not useful when the fault is in the EA and parameter optimization.

There is an easy step between training a network and optimizing an EA that could build confidence in the trained network and at the same time provide guidance for system design.

Why not analyze the performance of the network directly? You have a network trained on 1999 data, you have a lot of out of sample data. By measuring the statistics of the errors when the network is applied to out of sample data you can determine what type of system to design. You can also determine if the network requires periodic retraining. I admit that this won't lead directly to a profitable EA, but it will help decide on the structure of the EA, and give you a lot more confidence in the resulting system.

At one point in your posts, you said that you had a network that predicted the next bar high and one that predicted the next bar low. How good are these predictions? If they are perfect then use them to set pending orders at the predicted high and low, and then exit at the opposite extreme. If not perfect, but the error distribution is very tight, then you can write an EA that sends pending orders near the predictions, allowing for some error. If the errors are such that the error distribution of the high overlaps the error distribution of the low by a large amount, then you cannot use the predictions directly, but must devise another method to trade. And so on. It is even possible that you could directly set thresholds and calculate such things as the risk/reward ratio and the expected return/trade directly from the error statistics without recourse to optimization. Then backtesting an EA using these calculations will provide direct confirmation of the expected performance.

Error measurements on your other networks may be just as useful. The mse is not the whole story, since it may be small, but the error distribution may have fat tails. If all your error distributions are large, then the network may provide guidance only, and you may find it necessary to add other methods to trade to take advantage of the network hints.
Regards, MadCow
 
I believe MadCow is rigth here. Optimizing of EA parameters or using MSA to apply most efficient MM
method is just an addition. The core here is trained NN which gives certain prediction and analysis
of those predictions can give much better understanding how to build proper strategy using this NN.

Krzysztof
 
Human Brain and who gives a ****

And here something different. Here is an equity curve from manual trader (friend of mine)
who trades only looking into Stochastic, MACD and crossess of few MAs. Trades were taken from demo account so commision ans slippage is included. His method is hard do describe by himsef, says 90% is 'feeling the market'. Number of trades is 115 so this result
is quite significiant.

So human NN is quite powerful also it seems :D

Krzysztof
 

Attachments

  • AStrades.JPG
    AStrades.JPG
    192.3 KB · Views: 888
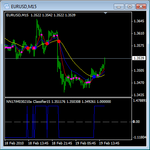
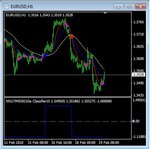
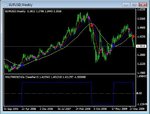
My NN indicator is working in all time frame without need any optimization, I have explained in brief why I can get it. Since the indicator inputs are moving average based (not the price it self) then it will not useful during price consolidation and only good when the market on trending.

I will try to use MSA or other genetic software or NSDT to evaluate my EA performance (after next 2 weeks...uuh). After getting the optimize parameter then it will be implemented directly on the EA.

Thanks to Madcow and Kryzstof,I wish more people can share his constructive idea on this thread...

Thank you
Arryex
 

Attachments

  • NNindicator on 15M.png
    NNindicator on 15M.png
    13.5 KB · Views: 789
  • NNindicator on H1.jpg
    NNindicator on H1.jpg
    31.9 KB · Views: 873
  • NNindicator on H4.jpg
    NNindicator on H4.jpg
    36.3 KB · Views: 852
  • NNindicator on Daily.jpg
    NNindicator on Daily.jpg
    39.6 KB · Views: 694
  • NNindicator on Weekly.jpg
    NNindicator on Weekly.jpg
    41.3 KB · Views: 711
Last edited:
Top