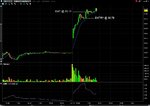
Breakout Trading using Time and Sales

In the level 2 do you only want to see Market Makers and hide ECN's? Is my level 2 set up right? I dont see goldman sachs or morgan stanley. On the level 2 quantity column there is only numbers like 4, 2, 1...Is that in thousands of shares?(4 = 4,000 shares). On the tape under size it shows 100, is that mean 100,000 shares? The market column shows EDGX, ADEN, NSDQ, are those the people who hit the bid or offer? If you dont want me to write in your journal just say so.

View attachment 129140

In the level 2, I want to see as many people as I can. So that includes market makers, ECNs, etc...It's not very common for big players like GSCO/MSCO/JPMS/etc...to come at or near the inside bid/ask. They do sometimes and you can play them well, but it's not very common. It's more common to see them far away from the current bid/ask (as is the case in your picture - scroll down the bid and you will find MSCO sitting there).

It is likely those sizes (4, 3, 2, 1) are lots of 100s. It is similar to IBs TWS time and sales screen. In a thin stock, if you put on 1000 shares, you can often see your trade printed on the time and sales and the size that appears is 10. So if you're doing 100 shares, it will appear as 1, 200 will appear as 2, etc...The best way to be sure is to find a stock that isn't moving too fast, take a 100 share position on it, see if u can find your trade go through on the time and sales and then you will know the ratio used.

EDGX, NSDQ, NSX, PSX, DRCTEDGE, NYSE, etc...are all ECNs. Market makers often use them to route orders secretly. Instead of GSCO sitting on the bid side evidently accumulating stock, he will play games with the bids/offers by routing his orders through ECNs so no one sees that it is him that is buying/selling.

The best way to become familiar with the economics of level 2 is to simply watch it. Find a trending stock, look at how the bids and offers behave, trades going through, orders being put or pulled. Don't do it with stocks like MSFT - there is too much noise there. Find a nice, slow stock with a tight spread and just observe.

Hope it helps.

It helps a lot thanks. I didnt know that about the ECNs. Sneaky bas...'s.:)

O, so the ratio is determined by Nasdaq?

Do you think its ok to trade a $5 stock? (I know Ickow said he only trades stocks between $30-$70, but thats kinda expensive for a newbie.)

O and I noticed that on my time and sales the smallest size traded was 100 and most where even 100's. Does nasdaq not report trades less than 100, no one bought less than 100 or the settings on my software hides trades less than 100?

I need to watch wall street warriors again...
 
Last edited:
It helps a lot thanks. I didnt know that about the ECNs. Sneaky bas...'s.:)

O, so the ratio is determined by Nasdaq?

Do you think its ok to trade a $5 stock? (I know Ickow said he only trades stocks between $30-$70, but thats kinda expensive for a newbie.)

O and I noticed that on my time and sales the smallest size traded was 100 and most where even 100's. Does nasdaq not report trades less than 100, no one bought less than 100 or the settings on my software hides trades less than 100?

I need to watch wall street warriors again...

Not sure what the ratio is determined by, but was simply saying you to try it out to make sure.

5 dollar stocks should be okay, though I wouldn't expect too large a move out of them. They are also good because cheaper stocks are less volatile, therefore good for the newbie. Don't worry about what Ickow does - his strategy, whilst relying on level 2, use different principles than the one in this journal.

I don't think trades less than 100 shares are reported. 100 shares is known as a block. I tried putting on 50 shares once on AAPL and surprisingly got a good fill, but did not see it go through time and sales.

Good luck!

watched you crack along for several years, amit
....kudos, mate, kudos!
 
Thank you, Joules.

FIS has been a great scalping stock today. Managed to get a total of 41 cents per share out of it, net of commissions, from 5 break out trades.

The key to FIS is the strong uptrend, tight stops, and an ability to get out when things turned sour.
 
Last edited:
This type of trading requires a bit of experience reading level 2 / time and sales. See attached broker screen shot of all FIS trades, plus a small loss from early morning KORS trade. My exit on KORS was too early - as soon as I exited, it shot right up. But it was far too volatile and so I decided to get out. I feel lucky to have gotten out for a small loss on such a volatile stock.


If anyone is interested in the chart, I can post it. But it's simply an uptrend with minor retracements.
 

Attachments

  • FIS_scalps.jpg
    FIS_scalps.jpg
    76.7 KB · Views: 158
  • Like
Reactions: D70
Got another 32 cents out of the FIS break out. Actually took an early entry on the 5-minute chart. I'll post a chart of this trade.

What I loved about this trade was:

i) Small risk as dictated by my small stop
ii) Great level 2 / time and sales buying pressure

Should have taken a larger size on it, but stuck to my usual 1000 share position.
 
+4 cents FIS reversal. Quick scalp.

Got into that because buying pressure was waning, overall markets falling. There were likely lots of swing-long positions from early on in the day who were likely looking to sell above the whole number. Small gain, though.
 
Here's that nice gain I just got on FIS. I really do like trades like these. Level 2 and time and sales showing strong buying pressure, low of the previous candle very close by, providing for a small stop, and a strong uptrend. In other words, a high probability / low-risk trade.

Entry: 30.78
Exit: 31.11
Net profit: +32 cents per share

I should have done a larger size on it, given how small my risk was (3 cents per share) and how strong buying pressure was.

FIS is currently on its fifth swing up now and appears to be topping out. If level 2 selling pressure intensifies, I will likely short. Otherwise, I am likely done for the day.

Good trading to all ! :)
 

Attachments

  • FIS_chartswing.jpg
    FIS_chartswing.jpg
    170.3 KB · Views: 178
  • FIS_broker2.jpg
    FIS_broker2.jpg
    41.7 KB · Views: 137
+15 cents per share FIS reversal. Was weak on level 2, so shorted on the 5-minute chart. Got it to the whole number and covered. Done for the day.
 
Thanks amit, i followed the link and read out complete trade journal, it gave me many benefits to know what exactly i have to do.
 
Lots of stocks to watch today. Among them, some of the noteable ones that could present good moves include: V, APOL, CEPH, GRMN, HRS, and MT. There are many others as well!

Hi Amit
Sorry if you discuss this later in your thread (I have only just started reading it whilst waiting for US to open) but what brought these stocks to your attention at the time?

Thanks in advance,
Steve
 
Hi Amit
Sorry if you discuss this later in your thread (I have only just started reading it whilst waiting for US to open) but what brought these stocks to your attention at the time?

Thanks in advance,
Steve

Hi Steve,

I read news pre-market and see which stocks are gapping up/down. For example, today I've got ZNGA, ACAS, MET, HIG, FTI, and FXCM on my list. And then, when the market opens, I have a scanner running which constantly gives me more opportunities throughout the day. I believe I have discussed this in detail in my journal, so no point repeating here.

Thanks Amit; appreciate it. I will read through the journal for sure.
Cheers
Steve
 
Results so far:

1) DF: +6 cents per share (2000 shares)
2) NSC: +24 cents per share (1000 shares)

both are based on mr. charts' setups
 
+18 cents per share NSC reversal (1000 shares)

this was a wild one, but buying pressure was building above the whole number and so I went long and had a stop below the $69 whole number...wasn't using opposite end of previous candle as a trailing stop only because it was so wild.
 
-6 cents per share (1000 shares) WAG reversal. Saw some buyers come in after the steep fall so went long. It quickly reversed though
 
Last edited:
-2 cents per share (1000 shares) ZNGA breakout failed...

a bit choppy now...need to be more careful
 
Top