Bob Volman Price Action Scalping

  • Thread starter Thread starter Kalp
  • Start date Start date
  • Watchers Watchers 279
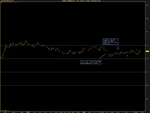
chart 15.9 page 297 complete novice view , get an opinion from a skilful trader.Lack of understanding of randomness ,weak on understanding support and resistance are all evident here.

I will leave this thread to you professionals.
 
Thanks, Bob, for the great annotated charts and the helpful guidance on the Ww/Mm pattern.
Thanks, BLS, for passing on the great comments and charts from Bob.

I recognized several marked entries were discussed this week in the forum. Looks like the group is starting to see through "Bob's eyes".
 
Thank you Bob and BLS!
Will need to be extra cautious every Monday after analyzing Bob's charts over the weekend because I start seeing more setups everywhere.
 

Attachments

  • 191112irb.png
    191112irb.png
    20 KB · Views: 206
Last edited:
My chart with notes.

The European session was price technically very nice, however I did not find any trades in the US session. Did somebody find a good setup?
 

Attachments

  • a.png
    a.png
    24 KB · Views: 214
My chart with notes.

The European session was price technically very nice, however I did not find any trades in the US session. Did somebody find a good setup?

None for me. Not much in terms of economic numbers this week. There's also an US holiday on Thursday.
 

Attachments

  • Untitled picture.png
    Untitled picture.png
    13.3 KB · Views: 182
  • Untitled picture1.png
    Untitled picture1.png
    12.5 KB · Views: 175
  • Untitled picture2.png
    Untitled picture2.png
    14.1 KB · Views: 189
My chart with notes.

The European session was price technically very nice, however I did not find any trades in the US session. Did somebody find a good setup?

Nice trade. I considered taking that one too but I drew the barrier 2 pips lower, and at that level the pre-breakout tension didn't look as good.

I was close to entering when the price pulled back for the first time following the breakout. This tested my barrier and it looked like a pretty good ARB setup. I was too cautious though and I decided to skip it. It was a countertrend trade, the pullback was short, and the signal bar could have been smaller. In summary, I was being too picky.

I didn't see anything else during the rest of the session.
 
My chart with notes.
In hindsight bias, I kinda like a small IRB at the triple bottom.
I've marked X's on the chart that shows the double/triple bottom and may be even a Ww pattern though the second w is a stretch - marked with x's.
I've marked the entry (black dot) for an IRB - range boomerang bounce from range low.
 

Attachments

  • wwexample.png
    wwexample.png
    26.9 KB · Views: 216
Thank you Bob and BLS!
Will need to be extra cautious every Monday after analyzing Bob's charts over the weekend because I start seeing more setups everywhere.

Took the same trade, but the break 1 pip higher. More out of impatience than anything. It definitely had that slow, lacklustre, diagonal drift of a bear flag. Should wait for opportunities with better odds.
 
My chart with notes.

The European session was price technically very nice, however I did not find any trades in the US session. Did somebody find a good setup?

Had my finger on the trigger for that break above 63, was just waiting for a little more squeeze. Consequently I missed a very good trade. Had such a great signal line too.

Was also thinking short in the proceeding action above/around 80 level, but wasn't confident I'd get 10 pip out of it - wrong!
 
In hindsight bias, I kinda like a small IRB at the triple bottom.
I've marked X's on the chart that shows the double/triple bottom and may be even a Ww pattern though the second w is a stretch - marked with x's.
I've marked the entry (black dot) for an IRB - range boomerang bounce from range low.

Hi shotgun77,

I saw four X's but no x's. Also where would you draw the inside range? Between 1.2753 and 1.2756, what time? Thanks.
 
@cha-ching
The five bars before the black circle form the inner range. It's aggressive but Bob says the boomerang needs aggression because it can break and move sharply. The inner range strength is coming from the double bottom - now triple so that is why I think the 5 bars are adequate.
I show 2 X's before the black circle. So the first of those is the triple bottom, then the bull bar, then doji, then a 4rth touch on the 2nd of the x's. In some price action circles, that is good enough to call it a double bottom. So a major double bottom then a minor double bottom.
 
Hi guys,

Thought I would finally join in. I have been simming Bob's method for a couple of weeks now on the 6E (EUR/USD futures contract) It moves almost identically to EUR/USD forex, give or take a pip or 2

I usually watch from 6am-10am Mountain time (8-12 Eastern)

Here's what I saw today. (time on the charts is Mountain time)

Nice to finally have a day that moved a bit during the US session.
.
 

Attachments

  • 19_11_2012.jpg
    19_11_2012.jpg
    100.8 KB · Views: 385
  • 19_11_2012 2.jpg
    19_11_2012 2.jpg
    100.9 KB · Views: 668
Last edited:
Hi guys,

Thought I would finally join in. I have been simming Bob's method for a couple of weeks now on the 6E (EUR/USD futures contract) It moves almost identically to EUR/USD forex, give or take a pip or 2

I usually watch from 6am-10am Mountain time (8-12 Eastern)

Here's what I saw today. (time on the charts is Mountain time)

Nice to finally have a day that moved a bit during the US session.
.

Good stuff. Your charts show a lot more bars than mine even though your chart is set to 100 ticks. It makes your setups look smoother and clearer. That second setup in particular is way clearer on your chart.
 
Last edited:
Back
Top