Bob Volman Price Action Scalping

Can anyone please tell me at what level they set their targets and stops given the spread/commission of their broker?

My broker offers a spread that usually sits between 0 and 0.3 of a pip, then I pay 0.7 pip per round turn. At the moment I set my target to 10 pip (receiving 9.3 pip profit on a winning trade) and maximum stop at 8.6 (risking up to 9.3 pip).

Do others increase their target to compensate? E.g. I could set my target to 10.7 and thus receive 10 pip of profit on a winner.

Thanks again everyone

I do adjust my profit target to take commission into consideration although I think it would be much easier on me if I didn't. I think it's a bit of greed on my part that I add 0.8 pip to my profit target (10.8 target, 9.2 stop) to cover the cost of commission since I see a lot of trades exceed the 10 pip limit. But it does make calculating risk (in terms of percentage of your account) easier since your max loss and gain is 10 pip. For your situation I think you could get away with setting your target to 10.7. Since your max spread is 0.3, if you add the 0.7 in commission cost, it's like having a 1 pip spread which is what Volman assumes when he teaches his method. Which broker do you use?
 
Note for anyone trading through MB Trading, using their Desktop Pro platform...

1. For a 70 tick chart, the start count for ticks appears to be from the first bar loaded in memory, not from the first tick in a session. So, what this means is if you look at a tick chart today, close the program and re-open it, the charts will NOT be the same. Maybe this will produce different signals - I certainly think so. At the very least, what you think you are backtesting will definitely be different in real time.

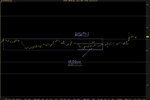
2. Once I brought this first issue to MB support ("someone will get back to you" - but never did), I thought I'd try the 1 minute bars, again in MB Desktop Pro. Their 1 minute (and possibly other timeframe) charts are all messed up, too. Just open the program, take a screenshot after 5-10 minutes of running, close and start the software again. Compare the bars. The bars will look very similar, but will be different (see attached for an example). I notified support of this, too - maybe it will be fixed. Note their MT4 data/charts seem to be OK. Won't help me, though - I closed my acct.


I think Bob Volman's method is challenging enough, without having to endure data integrity issues.
 

Attachments

  • differences.jpg
    differences.jpg
    71.2 KB · Views: 321
I do adjust my profit target to take commission into consideration although I think it would be much easier on me if I didn't. I think it's a bit of greed on my part that I add 0.8 pip to my profit target (10.8 target, 9.2 stop) to cover the cost of commission since I see a lot of trades exceed the 10 pip limit. But it does make calculating risk (in terms of percentage of your account) easier since your max loss and gain is 10 pip. For your situation I think you could get away with setting your target to 10.7. Since your max spread is 0.3, if you add the 0.7 in commission cost, it's like having a 1 pip spread which is what Volman assumes when he teaches his method. Which broker do you use?

Thanks BLS and virtuesoft.

I use IC Markets. There are an Australian broker based in Sydney.
 
Not sure what to expect from the afternoon session on American holiday.
 

Attachments

  • 121112irb.png
    121112irb.png
    22.5 KB · Views: 384
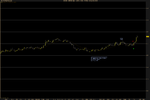
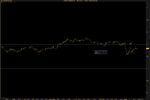
Decided to be a bit flexible with dojis not touching barrier before the break. Not planning to get into anything else after couple of hours of watching the market going nowhere.
 

Attachments

  • 121112irb2.png
    121112irb2.png
    20.1 KB · Views: 312
@vanica, I think Bob would say to wait for barrier break in slow market.
Page 148 says in slow market with subdued action, wait for superior conditions. But in a speedy market, you can risk an entry in order not to miss the move.
Page 139 says to squeeze the width in fast markets. But in slow markets, use the barrier extremes.
The strength of the bar after your entry makes it look like a lot of shorts got trapped in that false break. In these cases, I sometimes flip my position. Not often but sometimes on a BB that I thought could have legitimately broken either direction. I use the tick counter as my guide. If the opposite reaction is fast (fast tick counter), then more likely a trap and double pressure so safe to flip. Don't try it on very volatile days because you don't want to trade whipsaws.
 
The strength of the bar after your entry makes it look like a lot of shorts got trapped in that false break. In these cases, I sometimes flip my position. Not often but sometimes on a BB that I thought could have legitimately broken either direction. I use the tick counter as my guide. If the opposite reaction is fast (fast tick counter), then more likely a trap and double pressure so safe to flip. Don't try it on very volatile days because you don't want to trade whipsaws.

Yes, it was definitely a trap. But as many other traps, this one reversed pretty fast and I was more concerned about not missing the cross of my tipping point, than reversing my position. Though I agree it's a valuable skill to master.
Even the context of a slow day was supportive in my mind for this trade as break lower suggested continuation of a consolidation between 00 and 20levels. Well, another tuition fee payed.
 
I thought that cluster of bars between 11:40 and 12:30 provided a fair amount of support. I wouldn't go short straight in to this type of price action.
 
After going through some examples of IRBs from Bob's charts again, I think context wasn't too bad to trade this setup. At the same time, quality of the block could have been better. It seems that proper buildup is something Bob is looking for when conditions are a bit questionable.
 
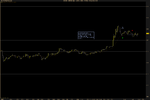
Two aggressive trades. Both are good examples of domination of technical reasons over fundamental/news. I was convinced by huge momentum that these moves were "special". In the end support/resistance proved me wrong.
 

Attachments

  • 131112fb.png
    131112fb.png
    19.5 KB · Views: 281
  • 131112dd.png
    131112dd.png
    22.1 KB · Views: 292
Two aggressive trades. Both are good examples of domination of technical reasons over fundamental/news. I was convinced by huge momentum that these moves were "special". In the end support/resistance proved me wrong.

I'd say there's nothing wrong with the second one from technical perspective.
 
I initially had my upper barrier one pip higher but then I decided to lower it because there were more touches. Price was moving a bit faster when I lowered the barrier but it did slow down a bit afterwards. Should've left it where it was. E1 looked good at the time since price did a ceiling test on the pullback but if you had the barrier one pip higher than the up move looked like an obvious tease break. I should've paid more attention to how price broke the upper barrier after breaking a small resistance level inside the range.
 

Attachments

  • Untitled picture.png
    Untitled picture.png
    14.4 KB · Views: 212
I bought this book and had a read of some of it and the strategies.To me it is the same old t/a rehashed , scalping around same old trend retracement strategies and range/box breakouts and same old stuff like 20 ema mentioned by Elder .

What other new stuff is there to learn from this book?

The tick chart part has helped and for this alone was worth the money for the book.

Any hints on what else I should be looking for? I already use moving averages , trend lines and support resistance and it works well for smoothing out price action , and it works for me.

Hi,

I only read the book twice but here's what's new and useful to me (not necessarily to you though):

1. Tipping point technique: never read Elder's Entries and Exits so I'm not sure if it's covered there. This alone has reduced damage when prices went against me in many cases.
2. Pre-breakout tension and many other useful principles, please refer to Glossary section and use Index to locate the examples.
3. His general keep-it-simple approach of execution (one-click order, to focus on the chart not P&L, etc.)
4. And of course his weekly charts showing how he reads the overall picture and how he adapts to different market environment (I have only reviewed a third of these charts).

Also in this thread there are many valuable posts that helped me understand the methods better (I have only reviewed about half of all the posts).
 
How many of you are profitable with this method of 10 pip stop and 10 target , and what hit are you getting , 60 % /70 %?
 
Top