Bob Volman Price Action Scalping

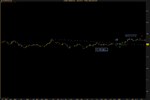
Market seems pretty quiet today. Perhaps the big players are waiting until after the US presidential election. One trade for me today. It didn't have the best squeeze but I though the price action before it showed a lot of tension and with a possible vacuum effect to the 00 I figured it was worth taking the 5 pip risk.
 

Attachments

  • USD Spot2-1.png
    USD Spot2-1.png
    14.8 KB · Views: 227
Market seems pretty quiet today. Perhaps the big players are waiting until after the US presidential election. One trade for me today. It didn't have the best squeeze but I though the price action before it showed a lot of tension and with a possible vacuum effect to the 00 I figured it was worth taking the 5 pip risk.

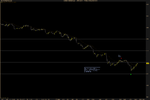
I took that exact same trade, but I basically took it twice. Got in too early the first time, and got in correctly the 2nd time. I think the one that we both took was valid, there was a decent fight before the break. Problem was probably that this trade was against the overall trend on the daily chart. Players on a larger timeframe will be skeptical to go long after major support just failed. 1.2820 was big support level that everyone was watching on the larger charts. But we shouldn't really pay attention to that stuff on our timeframe. I decided to trail very tightly because the bulls seemed skeptical to buy below 1.2800. The EUR/USD has broken outside of a bearish channel and lost a large support level.

1105 Bad IRB Trade.png

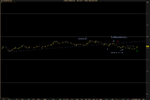
This was my first entrance. I had the right idea conditions-wise, seeing that the 80 level was holding up pretty well and the possibility of a vacuum effect but looking closely at the barrier fight, it's not that bullish. There's a much better fight on chart #2. Also, price broke above the top of the box 3 times, so it was a poor place for me to put the barrier.

1105 IRB.png

Luckily I was able to re-enter right away on a more valid break. I was not too happy about taking that first trade, but I was happy that I was able to brush it off and re-enter. I also was tempted to exit at like, 6 pips so I would end the day in the positive and cancel out the loss, but I decided in the long-term, it would be better for me to stick to proper trade management. I did trail very tightly though, because price was hesitant to break, and then hesitated again against that high to the left. Ended with -1 pip because of my first bad trade, but I think I did show better discipline after the first trade today, which is progress.
 
Two similar trades with basically identical trade management and result.
 

Attachments

  • 051112irb1.png
    051112irb1.png
    19.5 KB · Views: 203
  • 051112irb.png
    051112irb.png
    19.8 KB · Views: 206
The past two days have been very quiet. I'm yet to make a trade this week. Perhaps the US election is keeping traders on the sidelines for now.
 
I wrote up notes from the set of weekly charts from Bob.
Attached as Word doc. Let me know if you need another format such as pdf or rtf.
 

Attachments

  • volmanchartnotes.doc
    40 KB · Views: 252
Market has been much more lively today, though I didn't find many entries I'm comfortable taking. My only trade:
 

Attachments

  • 071112dd.png
    071112dd.png
    21.9 KB · Views: 230
Finishing earlier today. Chelsea is playing Shakhtar. One afternoon trade. If you didn't take it, would be grateful if you could explain why.

Thanks
 

Attachments

  • 071112irb.png
    071112irb.png
    19.5 KB · Views: 231
Finishing earlier today. Chelsea is playing Shakhtar. One afternoon trade. If you didn't take it, would be grateful if you could explain why.

Thanks

I thought the pressure was too even, note that the EMA is flat through the whole IRB setup. Can't really explain why, but the chart wasn't convincing enough for me that the bulls took over.
 
One hell of a process but it gets the job done. In Ninjatrader you can view the data as ticks or as 30 second charts or any other variant thereof.

Hi Tonylommich,

I just found that you can download MBTrading tick data directly from NinjaTrader if you have a demo account from MBTrading. Go Tools | Historical Data Manager | Download, then you can download the past 14 days tick data (check Tick and "Last"). Then you can open a new chart, change "days to load" from 3 to 14 you are done.

You can see the data in Edit -> Last -> Tick, check how many items (ticks) in each hour. I started recording the number of bars by hour from ProRealTime since late October, will post my numbers later so that we can find the equivalent of 70 tick ProRealTime data from MBTrading ticks, though I believe it doesn't matter too much if you just use a 30 sec equivalent.

I haven't figured out how to replay it though but at least you can have a bar-by-bar simulation for now.
 
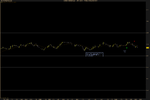
One afternoon trade. If you didn't take it, would be grateful if you could explain why.

Hindsight bias looking at your chart:
The pressure in the IRB was bearish.
See chart 39-12.
He likes that IRB because the pressure in the IRB was in the direction of the trade - in this case bullish for a long.

In your chart, I'm not convinced the bears at the dotted line have gone away.
The IRB itself looks bearish to me. It has 2 false breaks to the upside that closed as dojis. And more bars closed as bear bars on or near their low than bull bars with closes near their high.

It is a tough call though with the upsloping ema line plus double bottom higher low showing bull strength.
 
You can only replay data that has been either recorded or downloaded from NT. Unfortunately you can't download or import data from your provider and then replay them.

Multicharts Discretionary Trader is a free version of the Multicharts program. It'll let you do a market replay from a variety of datasources including MB Trading, Rithmic, Zen-Fire. I don't know if you can configure to do pips versus pipettes. I assume it matches the data source, which in my case is pipettes.

I really like Multicharts market replay feature though it takes a little "discovering" to figure it out. You use global mode to get intrabar updates. You use local to print full bars one at a time. It doesn't replay tick by tick but it's still pretty useful in intrabar mode. Speed of replay can be adjusted.

It's a burden to learn yet another charting software program but I really wanted the market replay feature so I figured it out. There's some youtube videos that show it.
 
Updated with flags comment. Otherwise the same.
Later today, I'll post some zip files with the charts in "concepts" folders matching my notes for ease of review.
 

Attachments

  • volmanchartnotes.doc
    42 KB · Views: 298
Multicharts Discretionary Trader is a free version of the Multicharts program. It'll let you do a market replay from a variety of datasources including MB Trading, Rithmic, Zen-Fire. I don't know if you can configure to do pips versus pipettes. I assume it matches the data source, which in my case is pipettes.

I really like Multicharts market replay feature though it takes a little "discovering" to figure it out. You use global mode to get intrabar updates. You use local to print full bars one at a time. It doesn't replay tick by tick but it's still pretty useful in intrabar mode. Speed of replay can be adjusted.

It's a burden to learn yet another charting software program but I really wanted the market replay feature so I figured it out. There's some youtube videos that show it.

Thanks. What version do you have? I found a 7.4.4953.0 somewhere which turned out to be a trial version. It's been discontinued from MultiChart's website.
 
Here's a zip to go along with my notes. It has the charts referenced in my notes organized into folders for easier review.
 

Attachments

  • concepts.zip
    4.9 MB · Views: 185
Thanks. What version do you have? I found a 7.4.4953.0 somewhere which turned out to be a trial version. It's been discontinued from MultiChart's website.

The website says DT is now available through Amp Global Clearing:
MultiCharts Discretionary Trader (MCDT) is now available through AMP Global Clearing « MultiCharts Blog

But it looks like you have to use it with their data feed (paid).

I have DT Version 7.0 Alpha 3 ( Build 33)

You could use the full version for 30 days trial. I did that once without a hitch.

I see they have a demo version of the MCFX. I've never used it. It doesn't say how long the demo version lasts so maybe it doesn't expire? But you probably can't do the market replay on it.
 
Re: Using Ninja Trader

Hi Tonylommich,

I haven't figured out how to replay it though but at least you can have a bar-by-bar simulation for now.


Hi. This is for those who want to SIM using NinjaTrader.

Ninjatrader keeps a database of market replay data on their servers, and anyone using NinjaTrader has access to it. I just checked, and they do have EUR/USD. I think they keep up to a years worth of data for the popular instruments.

They have some youtube videos showing how to download the data and others on how to use the replay feature.

To get the replay data:
Start NinjaTrader, but don't connect to any data servers.
Go to-> File->Utilities->Download Replay Data
You will get a popup window.
Under Type -> select Currency
Name is: EURUSD
You only need the L1 data for the replay.
Unfortunately you have to go through this process for each day you want to download, but with this data you can replay it as though it's real time.

Hope this info helps
 
Top