You are using an out of date browser. It may not display this or other websites correctly.
You should upgrade or use an alternative browser.
You should upgrade or use an alternative browser.
Not a suggestion to make any changes to Bob's method, but did anyone notice how often trades do get to the target if they don't take off after first 3-5 bars? I have a feeling that many of my losers started as losers and unfortunately I don't have that many winners to draw any statistics.
Not a suggestion to make any changes to Bob's method, but did anyone notice how often trades do get to the target if they don't take off after first 3-5 bars? I have a feeling that many of my losers started as losers and unfortunately I don't have that many winners to draw any statistics.
I noticed the same thing, although I don't have any hard data to back it up. It is definitely worth tracking - I'd probably look at P/L after 5 bars, and # bars in trade.
stehlikpetrmsncom
Active member
- Messages
- 194
- Likes
- 3
Do you see anything wrong/suspicious about the IRB I took?
It's part of a bigger head and shoulders pattern (head is the fight for 50 number), that is a little suspicious.
samich1262
Well-known member
- Messages
- 293
- Likes
- 3
Not a suggestion to make any changes to Bob's method, but did anyone notice how often trades do get to the target if they don't take off after first 3-5 bars? I have a feeling that many of my losers started as losers and unfortunately I don't have that many winners to draw any statistics.
I would not recommend looking into the speed of which a trade takes off too much. The reason is, I cut 3 or 4 trades early this month at break even or maybe a couple pips profit because I thought they were going too slow, and they went on to make it to the target. Then I had some losing trades, and my account went nowhere. If I'd stuck it out, it could have been a few positive weeks, but instead I basically went running on a treadmill. hahaha..
Most of my trades that didn't take off right away either didn't have enough squeeze or were taken straight into a 20 level. So I got in on tease breaks or did something that I knew was aggressive (like take a DD into a 20 level). I think we'll have more winners than losers once we do two things, learn to avoid the trap trades and learn to participate in the right trades. We're still letting some things scare us off that shouldn't, and going by the setup rather than conditions. Example, the BB/RB that we skipped at the 50 level today. BLS had a good explanation of that little block that we were afraid would stop the trade. He said the BB pattern formed because of that block (The BB was resting on it). In hindsight, I remember the book said that in the BB chapter. I forgot and skipped another beautiful BB pattern today.. Bah! Lol, we will get it eventually...
samich1262
Well-known member
- Messages
- 293
- Likes
- 3
Hey guys,
Take a look at Bob's charts, week 40 #18. On that ARB, where is he entering? It doesn't look like an FB or a doji... is he doing some kind of condensed SB or something? That entry confuses me.

Take a look at Bob's charts, week 40 #18. On that ARB, where is he entering? It doesn't look like an FB or a doji... is he doing some kind of condensed SB or something? That entry confuses me.
BLS
Established member
- Messages
- 642
- Likes
- 229
Hey guys,
Take a look at Bob's charts, week 40 #18. On that ARB, where is he entering? It doesn't look like an FB or a doji... is he doing some kind of condensed SB or something? That entry confuses me.
View attachment 148262
I'm guessing there wasn't enough stalling in the candle that did the ceiling test so he decided to wait a bit for more stalling. He needs some confirmation that the pullback is starting to turn back into continuation.
Morning trade. The pressure doesn't look that obvious but I remember similar example in Bob's charts and the block looked strong. I suppose next time I'll just draw barrier lines on my chart because still cannot solve this issue with rectangles.
Attachments
Last edited:
virtuesoft
Member
- Messages
- 94
- Likes
- 2
vanica, did you know that you can change the settings of a rectangle once it has been drawn?
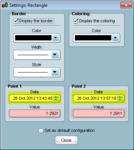
To do this, right-click on the border of the rectangle and click 'Configure Rectangle". You should see a Settings screen. From here you can change the two corner points of the rectangle. You can change the date to affect the width of the rectangle, and you can change the value to affect the height.
I've attached a screenshot of the settings screen. The date settings are highlighted yellow and the value settings are highlighted in pink.
Attachments
vanica, did you know that you can change the settings of a rectangle once it has been drawn?
Thanks virtuesoft. I can draw rectangles and they look ok in prorealtime. It's when I save the chart it becomes messy.
TonyIommich
Member
- Messages
- 79
- Likes
- 21
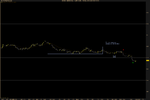
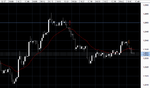
What I did today so far: First one might be considered an IRB though I'd sooner call it a classic double top. Worth a nice ten points. You can see that the up-trend was already struggling on the way up significantly. Logic: fundamentals came out, market initially sold off then rallied. The sell off wasn't just for 2 minutes for fakeout purposes, so it means enough people had bearish conviction. That bearish conviction got scared out when the market rallied, but the fundamental bears gave it another shot. That initial significant down move shows you the market had mixed opinions as opposed to pure upward bias.
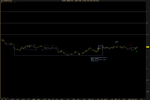
The second setup is a small 3 point scalp which shows a fake resumption of the prior trend then a double top. You know once this move fails they're going to gun the stop orders below that congestion zone. Very tough to trade something like that profitably but there are traders who do it. Its just a matter of practice.
The second setup is a small 3 point scalp which shows a fake resumption of the prior trend then a double top. You know once this move fails they're going to gun the stop orders below that congestion zone. Very tough to trade something like that profitably but there are traders who do it. Its just a matter of practice.
Attachments
virtuesoft
Member
- Messages
- 94
- Likes
- 2
What I did today so far: First one might be considered an IRB though I'd sooner call it a classic double top. Worth a nice ten points. You can see that the up-trend was already struggling on the way up significantly. Logic: fundamentals came out, market initially sold off then rallied. The sell off wasn't just for 2 minutes for fakeout purposes, so it means enough people had bearish conviction. That bearish conviction got scared out when the market rallied, but the fundamental bears gave it another shot. That initial significant down move shows you the market had mixed opinions as opposed to pure upward bias.
The second setup is a small 3 point scalp which shows a fake resumption of the prior trend then a double top. You know once this move fails they're going to gun the stop orders below that congestion zone. Very tough to trade something like that profitably but there are traders who do it. Its just a matter of practice.
Are you trading this way in addition to Bobs system?
I'm still trying to master Bobs system so I'm just focusing on that. I'm trying to keep things simple and not confuse myself with other ways of entering the market.
TonyIommich
Member
- Messages
- 79
- Likes
- 21
Are you trading this way in addition to Bobs system?
I'm still trying to master Bobs system so I'm just focusing on that. I'm trying to keep things simple and not confuse myself with other ways of entering the market.
I'm trying to be open minded about how I trade, to be honest. I have been deviating in places where I feel there is an interesting observation.
Bob says it pretty well on p 321:
"No matter how sound a particular approach and regardless its wonderful statistical record, in the bigger scheme of things it is nothing other than a snapshot of personal observation. Whatever seemed evident in the past, the future may and probably will defy it"
I think that argues for a deft approach and keeping your eyes open for what happens in the market. After all, somebody came up with the ideas presented by Bob (either his mentor, or he came about it through synthesizing other ideas). I think it always pays to keep an open mind.
Giorrgi
Well-known member
- Messages
- 253
- Likes
- 0
Not a suggestion to make any changes to Bob's method, but did anyone notice how often trades do get to the target if they don't take off after first 3-5 bars? I have a feeling that many of my losers started as losers and unfortunately I don't have that many winners to draw any statistics.
Take the following with a grain of salt because I'm still at the point where I haven't mastered the intricacies of the setups so I'm only starting to take the main trend into consideration.
Ok, call me crazy but i've been going though the setups in the book again doing what some might think is stupid: taking pip height of each setup, measuring how long it was and how much time it took to hit the target after the break.
The main reason is this: I've noticed that when prices do not advance fast towards the target after the break they stall out and either reverse back or just start backing and filling.
One thing that struck me after measuring Bob's charts in the book was that his ranges are always at least 10 pips tall. Also, they almost always reach target under 15 mins (except for one very long range, something like 2h30 hours that took 30 mins to reach target).
I've also noticed, and this has been pointed out before as well, that the breaks that do succeed are those where the price action inside the RB was somewhat volatile: usually, when the price action inside the range is mostly dojis, even though you might get a perfect squeeze (6-7 dojis between the EMA and the barrier), prices don't break properly and instead stall.
Therefore, breakout setups and in particular the RB, I try to take:
1. Ranges that are 10 pips tall at least
2. Ranges where at least half of the bars are not dojis
3. If the range doesn't reach target after 10-15 mins I and the PA is mostly dojis I start reassessing the overall pressure and looking for a potential reversal (higher bottoms/lower tops etc)
shotgun77
Active member
- Messages
- 128
- Likes
- 2
The main reason is this: I've noticed that when prices do not advance fast towards the target after the break they stall out and either reverse back or just start backing and filling.
This is very good analysis, Giorrgi. Thank you for sharing. I have not done a study but did notice on many of his weekly charts that target was reached after 15 min.
I also reread something he had said about how important momentum is and I think that goes with your findings.
BLS
Established member
- Messages
- 642
- Likes
- 229
Hi everyone, I am new in this forum and new in this forex world, I am reading this book and I would like to know where to find the tick chart to trade with BOB's method. Do you hany suggestions?
Thank You
Your best bet would be ProRealTime but that doesn't come cheap. Others have used the 30 second chart from OANDA with some success.
More charts from Bob:
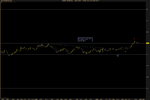
Here are the charts from Week 43. The markets are still in ranging mode, even when they trend on a bigger frame. That means that the best opportunities are found in RBs, IRBs, ARBs and the bigger BBs. My best advise would be to just lay low until these setups show up. And they always do, as these new charts evidently point out.
Attachments
Similar threads
- Replies
- 15
- Views
- 8K