Bob Volman Price Action Scalping

Hi Kulpio,

Thanks a lot for sharing your trading. Congratulation for following Volman's teachings. I know what it takes. I'm not trading currently using Volman's methodology, but plan to come back to it in the near future.
Your charts are very realistic and depict what an excellent student would trade after knowing the method inside out. Please keep posting your trades.

A couple of questions: Are you trading using Proreal charts, or just use them for visual aid and take the trades with another sort of platform?
How many hours per day are you devoting to trading like this?

Keep up the great job.(y)
Cheers,
Keen246

Hi Keen246,
Thank you for your comments. I am using prorealtime just for the chart. Then I use MT4 on the background and the oneclicktradinglevel2 plugin window on the side of my chart to buy,sell and close. So all I see is my pro realtime chart and my oneclicktrading window.

I generally wakeup at 4-5am (eastern time) and trade up to noon, so I get most of the action. I workout and breakfast from 6:30-8:30 during the UK lunch hours so I am approx. 5-6h per day in front of the chart. I used to just keep my chart open all day long and trade here and there without structure and it was really bad for me. I need structure, and it seems to pay slowly back. We will see how it goes.
I won't trade the next 10days as I will be in vacation, but I will update afterwards more regularly.
What kind of system do you currently use for trading? Are you full-time?

Thank you for your words,

Best regards
 
Hello,

Which trading platform/platforms are you using, is there a preferable one or not? I am based in the UK.

Regards
 
fwiw..i really can not see why anyone would be interested in those charts..i had a look at week 30 charts and closed them as fast as i opened them..imho..total waste of time and effort..but hey..that is just my opinion..never let anyone else put you off what you are doing..if it is working out for you..that is
 
fwiw..i really can not see why anyone would be interested in those charts..i had a look at week 30 charts and closed them as fast as i opened them..imho..total waste of time and effort..but hey..that is just my opinion..never let anyone else put you off what you are doing..if it is working out for you..that is

Can you please elaborate? why is it a waste of effort?
 
Can you please elaborate? why is it a waste of effort?

all you need do is look at one chart..very unprofessional..i would not risk any of my money on something that is put forward by someone in an unprofessional way..it tells a lot about the person

in fact..they have to be some of the worst charts i have ever seen..first impressions mean a lot..especially if trying to sell something..

What about it is unprofessional? Is it just that you do not like the way the charts look? or is there something else that is wrong with the charts?
 
all you need do is look at one chart..very unprofessional..i would not risk any of my money on something that is put forward by someone in an unprofessional way..it tells a lot about the person

in fact..they have to be some of the worst charts i have ever seen..first impressions mean a lot..especially if trying to sell something..

Beauty lies in the eyes of the beholder. Obviously you can't find the beauty of a clean chart. If you haven't read the book, you won't have a clue what they mean. But hey, there are tons of charts out there that look like a Christmas tree. Knock yourself out!
 
What about it is unprofessional? Is it just that you do not like the way the charts look? or is there something else that is wrong with the charts?

for those with tunnel vision..it is no more than the "same old story" rehashed..same as they all do..you will not find the real good stuff that easy..and..most do not have a clue where to even start to look..so..knock yourself out..LOL

how original:LOL:

there is a fool born every minute..that is one thing for sure:rolleyes:
 

Attachments

  • Screen Shot 08-09-16 at 08.19 PM.PNG
    Screen Shot 08-09-16 at 08.19 PM.PNG
    28.4 KB · Views: 259
What about it is unprofessional? Is it just that you do not like the way the charts look? or is there something else that is wrong with the charts?

as you appear to be the only one with some questions that make sense..yes..there is something else wrong with the charts..and..they are bog standard basic charts..very badly presented..in fact..terribly presented

go ask bob the builder if he knows anything about the relationship between charts of various timeframes..and how they enable the astute trader see where the big money are placing their orders..and..how to spot when they are buying into selling..and selling into buying

if anyone thinks they are going to find the best ways to make money in the markets..buy buying a bog standard rehashed book for $30 or so..then..all i will say..is..GROW UP
 
Please comment! I would've to know your thoughts.
Thank you
Best
Kulpio

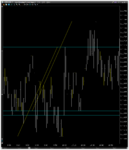
i think his charts are terrible..no symbol..compressed range..terrible color..and would need a magnifying glass to see anything

i do not trade fx..but here is the chart for Aug01 from 09:00 to 11:00..with a clear long trade..plenty of time to enter..and with a target that was hit

of course..hindsight is very easy..but that is why you need clear BIG charts so that you can SEE what is happening..worst charts i have seen in a long time..really
 

Attachments

  • Screen Shot 08-09-16 at 09.11 PM.PNG
    Screen Shot 08-09-16 at 09.11 PM.PNG
    94.7 KB · Views: 181
i think his charts are terrible..no symbol..compressed range..terrible color..and would need a magnifying glass to see anything

i do not trade fx..but here is the chart for Aug01 from 09:00 to 11:00..with a clear long trade..plenty of time to enter..and with a target that was hit

of course..hindsight is very easy..but that is why you need clear BIG charts so that you can SEE what is happening..worst charts i have seen in a long time..really

This is the most beautiful chart I've ever seen. You must be a genius!
 
as you appear to be the only one with some questions that make sense..yes..there is something else wrong with the charts..and..they are bog standard basic charts..very badly presented..in fact..terribly presented

go ask bob the builder if he knows anything about the relationship between charts of various timeframes..and how they enable the astute trader see where the big money are placing their orders..and..how to spot when they are buying into selling..and selling into buying

if anyone thinks they are going to find the best ways to make money in the markets..buy buying a bog standard rehashed book for $30 or so..then..all i will say..is..GROW UP


Could you please elaborate on this part?-

"the relationship between charts of various timeframes..and how they enable the astute trader see where the big money are placing their orders..and..how to spot when they are buying into selling..and selling into buying"
 
i think his charts are terrible..no symbol..compressed range..terrible color..and would need a magnifying glass to see anything

i do not trade fx..but here is the chart for Aug01 from 09:00 to 11:00..with a clear long trade..plenty of time to enter..and with a target that was hit

of course..hindsight is very easy..but that is why you need clear BIG charts so that you can SEE what is happening..worst charts i have seen in a long time..really

The symbol is always the EU. Besides the compressed view of the charts and the colour, is there something else that is wrong with the charts?

If you do not trade fx then what do you trade?

With your chart- what made it a clear long?
 
for those with tunnel vision..it is no more than the "same old story" rehashed..same as they all do..you will not find the real good stuff that easy..and..most do not have a clue where to even start to look..so..knock yourself out..LOL

how original:LOL:

there is a fool born every minute..that is one thing for sure:rolleyes:

Where should I start to look for the good stuff?
 
Where should I start to look for the good stuff?

in the mirror..when you have gained the required experiences..you will fully understand what this means

in the meantime..if you want to investigate real supply and demand markets..then..i suggest you look at a soybean related commodity..but..do not ignore the geo political and red tape issues..as..they do affect price..no matter what part of the cycle you find yourself trading
 
The symbol is always the EU. Besides the compressed view of the charts and the colour, is there something else that is wrong with the charts?

If you do not trade fx then what do you trade?

With your chart- what made it a clear long?

lot of questions..

1. emini's..US stocks..etf's..commodities..stock options..index options..futures options

2. clear long as base formed..price moved away from base

3. the charts are very basic..if you look at a single chart in isolation..be it time, tick, range or whatever display you choose..then..you are in effect ignoring the big picture..which can be a very costly way to trade

big picture for fx..is not the same as for stocks..which are not the same for commodities..you have to know the market you are trading..some can be very complicated..which is why sudden price moves are hard to explain..the more you understand..the better you get at deciphering price movements

this book..and the majority of others..do not explain the big picture..reason being..the authors do not know..if they did..they would be multi billionaires..and not trying to make a few $$$ selling regurgitated rubbish

simple really..you do not have to be a genius to work it out..a child can understand why when explained
 
all you need do is look at one chart..very unprofessional..i would not risk any of my money on something that is put forward by someone in an unprofessional way..it tells a lot about the person

in fact..they have to be some of the worst charts i have ever seen..first impressions mean a lot..especially if trying to sell something..

Hi Luidin,

Thank you for all your helpful remarks (very professional indeed). First off, I do not sell anything... where did you get the idea I am selling anything? Secondly, if you don't like my charts, then move on....so much energy and hate wasted from your part. (it also tells a lot about the person....)

Now back to my charts, Maybe I should have included the timeframe and currency for those who did not understand what this thread was about: EUR/USD 70 tick.

I trade purely on how I interpret Bob's system, so you might see something that I don't and vise versa. I did not realize how small my chart did upload. It is Trade2win that scales them when you upload multiple images at once, and I did not realize that. Your's big, cause you got ONE.... what can we learn from one chart???? Now in the future I will upload them one by one or two by two.... so yours only will be able to see them clearly. Yes, my chart is blue/white and yours black..... where is the issue?

There are literally millions of way to trade my friend, don't criticize one's technique by thinking yours is better... we are all here to learn and share, not spit on other's attempts.

If you don't like what I post, just scroll down, aight?

With my most humble regards,

Kulpio
 
Ok, I actually understand why my charts are too small... It is because my screen is a 27" and my chart takes it all. So when I screenshot and upload it, trade2win displays it much smaller which makes it hard to read. I will resize my chart before screenshoting. I guess one guy will be happy if I do so.
 
Hi kulpio,

I think u misunderstood. Lúidín was referring to the weekly charts posted at dropbox...

Good day...
 
Top