You are using an out of date browser. It may not display this or other websites correctly.
You should upgrade or use an alternative browser.
You should upgrade or use an alternative browser.
MagicInsight
Newbie
- Messages
- 5
- Likes
- 0
We all learned with a book where the charts are scaled down like this, so we're used to this now.
Also, we are looking to scalp 10 pips, so we are looking at 15+ pips move. By having a scale of 100 pips, it is easier to see if a 15 pips move is realistic.
Traderallen
Active member
- Messages
- 248
- Likes
- 41
Hi,
just out of curiosity: why is everyone in this thread scaling their charts so flat? I find it much harder to read that way.
Giorrgi has it right there is no real reason other than we all read the same book and use the same setups that the author has taught us. He shrinks the charts down to make the patterns easier to see, so we all do the same. I personally don't use any specific scaling I just grabbed the vertical axis and shrink it till I like the way it looks.
As Giorggi said, this is how everyone learned, through the book.
Personally I prefer when it is scaled down as it freaks me out when a one pip move is one inch tall. When it moves three pips, it looks like the grand canyon and my heart starts to race..... but when it is scaled like this, as Mr. Volman says, it is just candles marching through the chart.
It is just a personal point of view 😉
Have a great trading week!!
BLS
Established member
- Messages
- 642
- Likes
- 229
Week 32: https://www.dropbox.com/sh/1amxmi9af0fk6ej/VA5_ZrjQF1
sorry for being late, it slipped my mind
sorry for being late, it slipped my mind
Last edited:
garageboyFUJI
Member
- Messages
- 66
- Likes
- 0
Much appreciate BLS, Bob. thanks a lot.🙂
matty_dunn
Active member
- Messages
- 188
- Likes
- 17
Week 32: https://www.dropbox.com/sh/1amxmi9af0fk6ej/VA5_ZrjQF1
sorry for being late, it slipped my mind
Thanks Bob and BLS. I thought Bob might have finally taken a week off. The man is a machine!!!
Yorkshire Terrier
Established member
- Messages
- 620
- Likes
- 73
Thank you Bob & BLS.Week 32: https://www.dropbox.com/sh/1amxmi9af0fk6ej/VA5_ZrjQF1
sorry for being late, it slipped my mind
Giorrgi
Well-known member
- Messages
- 253
- Likes
- 0
Thanks Bob and BLS. I thought Bob might have finally taken a week off. The man is a machine!!!
Haha that's exactly what I thought !
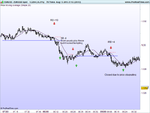
Took one trade on EUR/JPY (target : 15 pips). There are some charts on EUR/USD but nothing mind blowing.
Attachments
Yorkshire Terrier
Established member
- Messages
- 620
- Likes
- 73
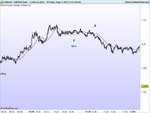
After a slow start to the week a few news releases to day got the market moving with some nice opportunities, or is it me being aggressive.
Feed back welcome.
Feed back welcome.
Attachments
Yorkshire Terrier
Established member
- Messages
- 620
- Likes
- 73
Giorrgi
What size do you use on PRT save chart settings.
What size do you use on PRT save chart settings.
Giorrgi
Well-known member
- Messages
- 253
- Likes
- 0
Giorrgi
What size do you use on PRT save chart settings.
You mean the way I save the chart images to post here? I actually take a screenshot and then cut it out in Paint... I know I know, lame, but I didn't really like the way charts were saved through PRT.
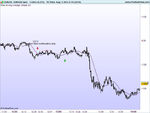
Didn't take any trades today, there was 1 good chart on EUR/JPY and one on EUR/USD.
Attachments
Hi everybody!
I have some questions regarding recent price action.
From what I have heard and read, does continuation setups like Double Dojis and First Break should be avoided? I saw, and I'm apparently not the only one, that prices do struggle to continue to travel.
Or do you think it is just a lack of volume do to summer?
Should DDs and FBs be traded only when they present themselves in a textbook matter?
Have a great trading day....
Kulpio
Traderallen
Active member
- Messages
- 248
- Likes
- 41
I myself view any type of scalping as a form of tape reading. If I feel I am in tune with the market that I'm comfortable taking whatever setups I'm presented. I think it depends a lot on what you train yourself to see, I trade the devil does you patterns a lot and I have a lot of winners. The first breaks that I trade are the ones that appear as a falling knife I'm looking for a lot of buying or a lot of selling real fast real quick that I watch my level II for a change in behavior and when I get that trigger candle uncomfortable taking that trade. I do think that during the low volume times that range breaks are more common.
Giorrgi
Well-known member
- Messages
- 253
- Likes
- 0
Hi everybody!
I have some questions regarding recent price action.
From what I have heard and read, does continuation setups like Double Dojis and First Break should be avoided? I saw, and I'm apparently not the only one, that prices do struggle to continue to travel.
Or do you think it is just a lack of volume do to summer?
Should DDs and FBs be traded only when they present themselves in a textbook matter?
Have a great trading day....
Kulpio
Regarding continuation patterns.
In the last three months I think Bob only took 4-5 continuation setups (DDs, SBs, FBs). Most of those were situations where momentum was very clear. Basically the trend was very strong and it somehow still managed to pull back to the EMA.
I remember seeing 2 DDs outside those extreme circumstances. In both cases the dojis which make up the signal line were lying on previous support/were blocked by previous resistance (chart included). In the example provided the dojis were touching a small line of bars which was acting as support before the break, and became resistance after the break (the fact that the doji line stopped around that level confirms this). Therefore prices were even less likely to climb back and breach that level. On this note I recommend that you check out Bob's analysis of the "last ceiling test" which is discussed somewhere in the ARB chapter (I think the first chart that discusses the pullback type ARB).
I personally don't take ANY continuation setups, they have, in my limited experience, something like 20-30% chance of working out which makes up for terrible odds.
All of this is linked to the fact that for about a year now Forex hasn't been very volatile. Prices tend to break a support/resistance line and then test it back again retracing it completely. If they don't do that, they will consolidate around the EMA after a strong trended move and stay there for an hour or so and, if they decide to move in direction of the original break, they will only do so after 30 mins 1h (sometimes much more, it's just a duration that I kind of noticed myself). Therefore NO IMMEDIATE continuation here. In fact if you try to trade for continuation you'll face an annoying retrace.
That's just what I've seen so far.
Attachments
Giorrgi
Well-known member
- Messages
- 253
- Likes
- 0
Hi Giorrgi,
Thank you for your reply.
I had many losses because of this kind of situation, where everything looks good for a continuation and then, blop, followthrough breaks down and then everything flattens...
But recently, I had some quite good trades after big news. And it is maybe the only time we should trade continuation setups.
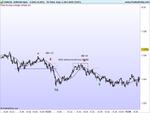
Today, for example, after the consumer confidence report of Michigan, I was able to scalp a SB...see below.
Giorrgi, it looks like we took the same (almost) trades today!
Have a great week end!!!
Attachments
BLS
Established member
- Messages
- 642
- Likes
- 229
Similar threads
- Replies
- 15
- Views
- 8K


