Becoming a successful forex trader

Evening Ampro

For what it’s worth most of what you write is not actually that relevant to my style of trading / learning. I understand what you have written but it is far to ‘global’ for me.

In setting up my charts I rarely look back any further than a few days and, in most cases, I am set up basis yesterday and what I see developing today.

Yep, & that's fair enough.

Folks don't really need to tag each other every step of the way to derive an income from what they do.

As long as they fully appreciate, completely understand & respect the risks & potential of the grid from which they operate then they're a step or 3 ahead of most out there.

You sure got your table set out & your s*** wrapped tight, always an advantage :)

Good luck & good trading!
 
Hi

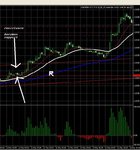
A couple of nice predictable moves on euro /usd

After a couple of higher highs and higher lows just jump in with a stop below the low of precceding low of trend?

These moves are confirmed as valid entries if price remains above the high for over 60 minutes or a reasonable time period


Any other conditions to be met before entry?

OILFXPRO
 

Attachments

  • PROFITABLE EURO USD SET UP 1 AND 2.jpg
    PROFITABLE EURO USD SET UP 1 AND 2.jpg
    295.7 KB · Views: 381
Hi

A couple of nice predictable moves on euro /usd

After a couple of higher highs and higher lows just jump in with a stop below the low of precceding low of trend?

These moves are confirmed as valid entries if price remains above the high for over 60 minutes or a reasonable time period


Any other conditions to be met before entry?

OILFXPRO


Good call. Looks like a trending morning. I was long GBPUSD at 2.0075. I also had a light area of importance marked at 1.0085 from some over night activity and a fairly quick move back above that area validated my initial analysis. Then it was just a case of seeing how far I want to take it. Obviously the first area was 2.0118 ish which it reached after a brief consolidation (which again is validating). Next target was of course our good friend 2.0178 which it has now reached. I didnt quite run my position that far but made over 50 pips which I am very pleased with since my weekly target is circa 50 - 60 pips.


Steve.
 
Hi folks

Here is a classic example of how previous reasistance becomes support and a buying opportunity.Today's trades and a hundred pip ride

OILFXPRO
 

Attachments

  • PROFITABLE EURO USD SET UP 1 AND 2.jpg
    PROFITABLE EURO USD SET UP 1 AND 2.jpg
    295.7 KB · Views: 479
  • resistance becomes support.jpg
    resistance becomes support.jpg
    288.1 KB · Views: 492
  • resistance becomes support2.jpg
    resistance becomes support2.jpg
    122.3 KB · Views: 304
Hi

another entry

OILFXPRO
 

Attachments

  • oilfxpro steve.jpg
    oilfxpro steve.jpg
    235.2 KB · Views: 2,982
Hi folks

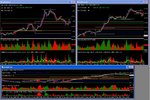
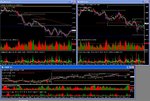
When trading gbp/usd or euro/usd keep both charts open .Look for confirmation on both charts and it will filter out a lot of false entries

Some traders may prefer a third chart euro/gbp

OILFXPRO
 

Attachments

  • high probability  set up on euro  usd and cable 29 05 2007  am.jpg
    high probability set up on euro usd and cable 29 05 2007 am.jpg
    228.9 KB · Views: 3,244
  • high probability  set up on euro  usd and cable with euro gbp.jpg
    high probability set up on euro usd and cable with euro gbp.jpg
    229 KB · Views: 1,128
Hi

There are many metatrader forex forums with over 3,000 indicators.95% of these indicators do not work.Imagine yourself driving a car and the car infront of you indicated after taking a turn,that indicator is lagging and useless.The idicator is telling you after the even that the car has turned right ,come into your path and u have an accident

Learn candlesticks,price action and chart patterns

Any good books out there on great set ups?

Anybody read this book?

suriNotes.com, suriNotes, Stock Research, Futures Trading, Emini Trading, Tradestation, Indicators

OILFXPRO
 
I'll take simple bar charts over the candles (just got used to them and never liked the bulkier candles) but its good advice.

I have only read extracts of Suri's book but I have seen it highly recommended.

What does a Waddah Attah explosion show you though?
 
Upward Spikes/ Downward Spikes

Today's lesson

Respect the spikes.Often the spike is an indication of where the market wants to go , but the sellers manage to come into the market and push the price back.

In this example the market make an upward spike in the first attempt.The sellers come in to the market and drive prices lower .Once the sellers (supply line is cleared) , the way is now cleared for an upward thrust

Respect all the intraday spikes

OILFXPRO
 

Attachments

  • upward spike.jpg
    upward spike.jpg
    168.4 KB · Views: 579
I'll take simple bar charts over the candles (just got used to them and never liked the bulkier candles) but its good advice.

I have only read extracts of Suri's book but I have seen it highly recommended.

What does a Waddah Attah explosion show you though?

Nine

The waddah attar is a volatility breakout indicator.It is made up of MACDS and shows when the market has a major force behind a move.

I use my own indicator called OILFXPRO RSIOMA which is a custom indicator

A PICTURE IS WORTH A THOUSAND WORDS

OILFXPRO
 

Attachments

  • NINE RSIOMA.jpg
    NINE RSIOMA.jpg
    288.9 KB · Views: 1,746
95% of these indicators do not work.

Learn candlesticks,price action and chart patterns

I certainly agree with your comments regards most indicators. Divergence plays can be harmless if they're observed correctly in tandem with the near-term flows, but most of them can be deposited in the trash without a second glance.

If more folks paid due attention to the prev area's & zones on the grid where minor & major battles ensued (s&r) instead of attempting to pick tops & bottoms and/or chasing the coat tails of an (intraday) aggressive run, they'd maybe afford themselves better odds of survival.

It isn't exactly rocket science to sit back & run a cross-hair along a 240 or 60m grid for 5 or 10 minutes. Transfer that info down onto the micro timeframe of your choice (if that's your poison) & wait till the action hots up around it.

I mentioned a couple levels earlier in the week on the Cable which were due a little activity: 2.0100, 2.0220 up to today's hot zone @ 2.0350 where the brunt of the London rush hour is focused.

Those levels were highly visible, easily located & not too difficult to unearth, from as far back as Dec 07 (plotting forward).

Given that these kind of levels hide a good chunk of stop activity (which drives these babies), it's not particularly mentally taxing to wrap a set-up or two around levels & zones which are likely to involve increased (volumes) activity....either as entry, pare off's or exit camps.

Makes life a little easier to maybe run one or two of your positions whilst maybe reducing transaction costs & top line expenditure.

I dunno, just a suggestion or two :)
 
Today's lesson

Respect the spikes.Often the spike is an indication of where the market wants to go , but the sellers manage to come into the market and push the price back.

In this example the market make an upward spike in the first attempt.The sellers come in to the market and drive prices lower .Once the sellers (supply line is cleared) , the way is now cleared for an upward thrust

Respect all the intraday spikes

OILFXPRO

If you get a good intra day spike then drill down and start checking some volumes. Check several time frames. 3min / 5min / 10min / 20min for intra day tarding. Try and work out where the lions share of trading has taken place within the bar. Mark it up for future reference. Push it out onto a 1 hour or a 4 hour chart and look and see if it lines up with anything nice. This isnt mechanical, it's a pure eyeballing.
Whilst spikes can, as FXPro says, be sign of futher progression of the current trend it can also be a reveral point where the final 'mugs' that have been holding out (ie positioned countertrend) roll over and shut their big fat losing positions thus creating a very short term demand or supply of contracts.

Hope this furthers the lesson. Remember, when you plan and execute a trade always be prepared for all outcomes.

Steve.
 
Hi Ampro

I think the daily areas of support and resistance are are areas to watch.These tend to produce good results if traded properly.


The 2 and 3 day support areas are also important and I would like some input on this thread

Area's to watch are dictated purely & simply by the vibration of price as it encounters a level of relevance, regardless of which timeframe it morphs from. That's what I've been taught anyway.

Sure, a closing level or zone which gets tagged solidly from Daily or Weekly activity deserves due attention, but I personally like to see a buzz of activity around a level, whether it hits from above or below.

If that activity is better magnified via a 240 or 60 (closing) reference then I won't overlook it.

But like I said, it all comes down to how you've been taught & your personal experience with playing that type of game plan.

Whatever twists your melon I say. Long as it pays you a wage.


Not entirely sure what feedback you're looking to generate from your 2nd link??
You've stated a set-up & game plan & laid it all out. What's to discuss?
 
Area's to watch are dictated purely & simply by the vibration of price as it encounters a level of relevance, regardless of which timeframe it morphs from.


Not entirely sure what feedback you're looking to generate from your 2nd link??
You've stated a set-up & game plan & laid it all out. What's to discuss?

Please define vibration of price for me and new traders.Maybe it could be a stochastics indicator at those levels and a failure to break lower

As regards second link ..what else should be added to the conditions of entry?POSITIVE/NEGATIVE NEWS FLOW,ADDITIONAL FILTERS ETC ETC just anything that would improve the strategy

Attached is a chart showing the breakout of the dailies and sitting above resistance

oilfxpro
 

Attachments

  • DAILY EURO USD.jpg
    DAILY EURO USD.jpg
    304.5 KB · Views: 350
As regards second link ..what else should be added to the conditions of entry?POSITIVE/NEGATIVE NEWS FLOW,ADDITIONAL FILTERS ETC ETC just anything that would improve the strategy

If you're directing the comment to me, then I've absolutely no idea what ought to be added or not. I'm not interested in trading it, but I guess if others are then you'll obtain feedback.

If you want price vibration defined (in direct reference to my post regards the Cable levels), then haul up a 240m and/or 60m where relevant & pop your lines across it.

Drill into the smaller (micro) timeframes & observe the vibration or activity around the levels.

If you got a set-up or trigger to take advantage of the move(s) away then all good & well. You certainly don't require stochastics or rsi or adx or fibonacci or gann or any other pot of cream to take a trade onboard.

That's not to say you can't utilize them or add a little flavor to your pot, but you definitely don't need them.
 
Hi

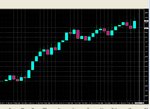
If you were to trade euro/usd again today ,at what level you buy or sell and why

OILFXPRO
 

Attachments

  • euro usd 13 3.jpg
    euro usd 13 3.jpg
    208.8 KB · Views: 293
There are many metatrader forex forums with over 3,000 indicators.95% of these indicators do not work

Does that mean that 5% of the 3000 do work ? If so that still gives 150 indicators worth using


Paul
 
Top