Dick Lexic
Veteren member
- Messages
- 4,954
- Likes
- 124
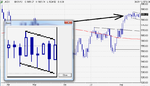
notice how the ftse bounced off 5839 the buy pivot
we all seem to get to the same place via different routes🙂
notice how the ftse bounced off 5839 the buy pivot
we all seem to get to the same place via different routes🙂
Have to hold up my hands and say it became a very funny looking IHS (1min chart). It's like my error yesterday when I predicted a 5min W which then got hammered into an M and it plunged into the head of a large IHS. Perhaps this has failed into a cup and handle. If we survive the beat down at 5843 ... bouncy bouncy time again! :clap:
et is it a coincidence that since u started posting predictions on this thread the number of people viewing has gone from 15/23ish to 75 !!
👍
Thanks. It's back at 19 now... maybe it's lunchtime.
One reason I'm posting is to put pressure on myself to be consistent and to iron out a few psychological tendencies I have -
* I still catch myself thinking that price will move in a straight line, especially intra-day signals at 30 min - 4hr level, they must reach their targets right away
* I still examine lower charts after my prediction based on a higher chart has been made and then get confused because they seem to show the opposite. (lower charts can fake signals against upper, if upper was first)
and also to train myself to order my thoughts in terms of a narrative from higher to lower, so that I make one or two major predictions per day instead of dozens and dozens or small ones in succession, which is tiring, and means you lose the 'big picture'.
Most of my time training myself has been spent on 1 min chart, where I don't have a big picture view.
This is great because I've only got to make a couple of important decisions about the big picture, then I can leave the chart or return to interpret it in terms of the prediction.
BTW how do you calculate your buy and sell pivots?
I've calculated annual pivot points for the FTSE. Don't use them any more but they are pretty cool, and you can drill into them (50%) for extra lines. One is at 5827.9. I don't know how to create buy and sell lines though.
Dow +12 should be +70
current time 14.38
Cheers.
For daily I used to calculate from 7am to 8pm previous day. That's because the old Labrokes/Spreadex chart often had unusual volatility before this time that wasn't present on other charts, which I never knew whether to include or not.
De Mark's
5846.9
5789.4
Floor pivot point: 5831.5 (this is close to annual pp of 5827.9 which is why when I was trying out pps I decided to stick with annual... meant I didn't have to recalculate every day).
Another fun thing you can try with annual pivot points - something I'm not doing, but it's another cool observation - you can place secondary lines equidistant either side e.g. 10 pips. You will find that whole zone either side of the annual pivot point is either a buy or sell region. With 5827.9 and 5871.1 it looks pretty awesome on the chart at the moment. Don't know whether it is a useful basis of a trading strategy and I'm not using it.
You understand Demarks trading methods?
Tom DeMark is highly rated, but the method is difficult to understand
et keep an eye on JPM and GS, GS above 100day ma and JPM approaching it, will change tone of market
FTSE pivots for Tuesday
Buy 5839
Sell 5833
FTSE close = 13,262
posted 17:15 20 aug
No, I'll look into it.
Okay. I've ignored stocks so far but I may have a look at those now.
BTW I don't know whether the day chart is a bullish or bearish flag. I think I need a good chart higher than monthly (two monthly/quarterly?) to make a decision.