barjon
Legendary member
- Messages
- 10,752
- Likes
- 1,863
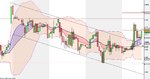
What about all the other pin bars on the chart that are not at the bottom? :whistling
oh come on, reksa, don't spoil a good story 😆
What about all the other pin bars on the chart that are not at the bottom? :whistling
oh come on, reksa, don't spoil a good story 😆
What about all the other pin bars on the chart that are not at the bottom? :whistling
That's for you to sort out. 🙂 Knowing that those two were the ones is what is called "having an edge".
hmmm DAX almost at S2 after hitting R1 what a turnaround!
I see your using PRT. How do you find those pivots?
i dont base my trading on Pivots but do keep an eye on them as targets sometimes.
On the DAx they seem to offer realistic support & resistance zones
Cool. Did not know if it was part of your trading system.
Just wanted to make sure you got the code for the pivots as the stock ones are calculated over 24 hours.
ftse hourly looking better
well i wanted some volatility -
you know what they say beware what you wish for :-(
Long DAx 6758 stop at entry fingers firmly crossed
Yes, I liked the hourly chart too until the sell off. FTSE did an exact 127% extension and is now pulling back into old support at 5903. 50% retrace is 5905. 61.8% is 5911.5. Unusual to get such a pronounced V shaped reversal. The ES usually has a go at the extreme within half an hour of the low. Nothing so far.
Do you still have a play on the 16:29 candle?
Did that ever happen before or am I making things up?
It works some days and does nothing on others. You need to superimpose the FTSE over the ES on a 1 min chart, and usually the FTSE will drift up or down away from the ES. The trade is to go with the direction of the drift and close it at 4:30pm. I am not convinced it works consistently enough. When there is less eurobabble going on it works better.