Anyone scalping the FTSE Futures??

hey guys this volume chart comes free from livecharts uk. the weekly chart volume has been giving me probs lately but it's not crucial to my trading. each day i set up a i min and a 10 min chart from this site and to be honest the volume they show looks spot on to me. have a look at the hourly chart attached. look at the volume attached to the opening candle this morning 8am ...that put a fair old downer on the day! maybe some of you want to try this out .....the best thing is it's free!:)

Ftse 100 Chart - Stock Market Live Chart
 

Attachments

  • hr.gif
    hr.gif
    34 KB · Views: 141
Is anyone scalping or trading ST using an actual futures broker or DMA access if so who are people using ?
 
some times a bar with a smaller range and more volume can indicate buying/selling pressure. these free volume charts have shown more volume on the 1 o'clock bar than on the 12 o'clock bar... maybe there was a bit of buying on the 1 o'clock bar....just a thought:)

don't slate me if it tanks
 
hi reksa, this is the same one i had problems with before ...cash

Dick.
Just had another look at your chart.
I have never used livecharts so I could be wrong. But where you have selected volume and then have entered some numbers next to it makes me to think this is a volume oscillator between those moving averages you have entered.

Which would confirm why we did not see a spike in last weeks volume.

not sure reksa, i see what you mean but these figures are the default. i have taken them out but still the same weekly spike....
 

Attachments

  • week chart.gif
    week chart.gif
    39.5 KB · Views: 151
not sure reksa, i see what you mean but these figures are the default. i have taken them out but still the same weekly spike....

No idea then Dick. :confused:

But its not the index volume for sure and that can be checked on LSE.

Could be the Futures contracts traded? It is called Futsee 100 :D but its not the correct price for the march contract.
 
Is anyone scalping or trading ST using an actual futures broker or DMA access if so who are people using ?

Shaun

I use Open ECry as my direct access broker. I really like using the platform. Charting is ok to good with no data fees. Tradestation and Ninja charge for data and platform. The only negative is no time and sales data. If you are interested I will give you a contact name. I pay $1 per side per lot plus exchange fees for the FTSE. It works out as roughly £1.80 total per lot.

ps You also can't trade the FTSE futures using Tradestation. Don't know why. I have asked them several times to offer it but that's little bitty limeyland and they don't know where it is on the map.
 
No idea then Dick. :confused:

But its not the index volume for sure and that can be checked on LSE.

Could be the Futures contracts traded? It is called Futsee 100 :D but its not the correct price for the march contract.

thanks reksa, i don't relly need it ...i'll just keep messing about with it ....maybe some other folks will try it out and get to the bottom of it.
 
Nice start but turning slow. Good bounce of yesterdays low, and printed it a point below. Then a bounce of the yesterday evening high.
Then a 61.8% retrace of the morning rally.

Could be all systems go over lunchtime with BOE and Draghi.
 
I just wanted to post up a chart of a trap. At the open this morning we had a nice push down at 8:06am that pulled back at 8:20am, but there was no continuation of the move down. In fact it took a further 10 minutes before there was a 1 tick move back down. I like to enter on a pullback and then continuation in the direction of the trend. Entering on a limit order at a moving average can leave you trapped, which is what happened this morning.

Firstly, why did it reverse at 5826.5? Well 5828 was the FTSE future price at the close of the cash market at 4:30pm yesterday. So a bounce off this level was likely. Also, it is normal to get 3 trend bars on the 5 min chart at the open before a retest. Getting a 4th trend bar at the open means this is a strong move.

Alright so it reverses at the expected level. Then you look for a with trend entry after the pullback. Personally I look for a bounce off the middle bollinger band (12 period) on the 1 min chart. And I would enter on a sell stop on the first 1 minute candle to make a lower low.

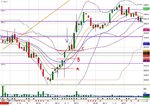
Well the first warning sign that a reversal may not happen shows up at point A at 8:23am when it sails past the mbb without any move back down. Then at 8:24am we get an inside bar. Again no lower low to enter on a sell stop for a continuation down. At 8:25am we get a move higher than the high of the 8:24am candle. For an aggressive trade this would be a long entry.

At point B at 8:26 am we even get a small gap that doesn't fill. This is starting to trigger some stops of those short.

The final chance for the price action to bounce is at point C at 8:27am when it should pause and bounce off the 37SMA (the dotted purple line), which is the same as the mbb on the 5 min chart. In all this move there has been no down tick, until 8:30am and we get a move of just 1 down tick that is pushed back immediately and becomes an outside bar. This triggers a bunch of stops and the price moves up quickly.

So what does this teach us. Firstly entering on a limit on a pullback can leave you trapped. Entering on a stop order on the first with trend move is a safer entry, most times. Secondly, look for trapped traders who can't get out of their trades, especially if the market does the unexpected and reverses with strength.
 

Attachments

  • 9 Feb 2012 No pullback on 1 mc.jpg
    9 Feb 2012 No pullback on 1 mc.jpg
    206.2 KB · Views: 172
Last edited:

Does your 12sma give you any bias on the 1mc? As 8:24 held above.

I know what we are doing is very different but it was always looking like the 5 min candle would close above the mid boly. 27,28,29 on the 1mc above the 37sma. So if the bias change is there where are you looking to enter? As you said it shot up after that.

The timing of my trades does not have to be as precise as yours, but its always nice to time them so they don't go offside by more than 4pts. :cheesy:

I have been taking some trades off the the 37sma. I will try to get some charts of my trades up over the weekend and hopefully get some feedback.


Hi Mark. Sorry for the late reply. I have been out if the office this afternoon.

Firstly, thanks for the correction. So just to confirm, I use the 12 period boly on the 1 mc, and the 8 period on the 5 mc.

The mbb on the 1 mc is the first reference point for my trading. Below it I should be looking at shorts and above it I should be looking at longs. Unless the price action is smaller and flip flopping when I won't use it as much. In those cases I tend to look for bounces of trendlines.

For the change of bias on the trap trade. An aggressive long would have been at 8:25am, and would have been on a buy stop at 5835.0. The reason being it should have bounced off the mbb on the 1 mc and gone back down. But it didn't. It continued up to test the ubb on the 1 mc and the mbb on the 5 mc. Now normally there should be a bounce there too. But again it didn't, and when it pulled back slightly at 8:29am, and went on to make a new high at 8:30am was when the shorts were trapped and ultimately stopped out.

I checked my records and I went long three lots at 5844 at 8:30:49. A bit late for most of the move, but considering the relatively strong down move between 8:05 and 8:20am, at least I caught some of the reversal.
 

Attachments

  • 9 Feb 2012 No pullback on 1 mc.jpg
    9 Feb 2012 No pullback on 1 mc.jpg
    205.1 KB · Views: 149
Last edited:
my curiosity is killing me split... are your wheels still on?

It's going very well. Bread and butter trades mostly. I'm trying to work on different timeframes. I'm not doing too much differently. It is the way you manage the trades once you have decided to open them. Get tough in cutting losses, Dick, or profitable ones that look as if they are looking riskier. It's what Feb says, other ones will come along. "Breathing space" is a term designed to give the market time to get money out of you.

I think that some of TRO's ideas can be adapted to longer term trading, too, but it is essential to use his tactics on the right timeframe.
 
Top