Anyone scalping the FTSE Futures??

ok guys i'll put them back up:)

i'm doing something today i promised myself i would never do ....i'm long and staying there with a huge stop even though it's nfp "no frekkin prisoners" day :)....small stake..

I'm no economist Dick, but going from what I have read this report has not been easy for people to predict. ADP for December had a big revision downwards and missed expectations on Wednesday. But ISM was good.
Going by market reactions, where at times are the opposite to what you expect, I'm making sure I'm flat.

yeah i crapped out reksa but price just ain't giving me a sell signal at least not yet ......im flat
 
yeah i crapped out reksa but price just ain't giving me a sell signal at least not yet ......im flat

Yes every attempt to move down has been short lived. The candles are not working for me so I am just sitting on my hands.

We might get a 161.8% extension.
 
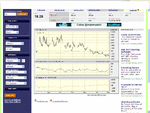
here is the vix/ftse chart again..you can see the vix balck bars looks weak as the ultimate oscillator stays below 50. in october the compare% line starts to rise form -100% and crosses the +0% line around mid dec/jan this gave a good signal ..check out your daily charts. the ftse line (yellow) looks like it doesn't move much but that's because it's comparing a 5000 price range with a 20 price range... axis thingybob or something. anyway enjoy:)
 

Attachments

  • vix.gif
    vix.gif
    69.1 KB · Views: 117
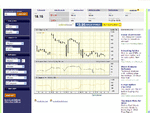
here is the ftse intra day the problem with this is that the vix is always delayed
but still helpful watching the % lines i think.
 

Attachments

  • vix2.gif
    vix2.gif
    72.5 KB · Views: 122
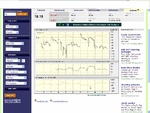
s&p intra day you can see the +0% line gives a few buy signals also it doesn't seem to happy above the +10% level which is where we are now!!

have fun :)
 

Attachments

  • sp.gif
    sp.gif
    70.2 KB · Views: 133
s&p intra day you can see the +0% line gives a few buy signals also it doesn't seem to happy above the +10% level which is where we are now!!

have fun :)

See what i mean Dick re the news?

1.30 certainly caused a spike i wouldnt have wanted to be short on!!
 
any excuse and they ramp the price ..now they can afford to sit back and watch us day traders try to get in on it and likely ramp it against us now until they are ready for more..i suppose they'll all be in the bar now swigging cocktails:(
 
danboi

Martin CJ post 5172 ( I think) about the fibs levels etc is absolutely excellent and a must print out for you

I know you state you don't use fibs but I urge you to take that post seriously

fletchie:D

Case in point. Why did the FTSE bounce off 5786.5 at 12:20pm? Because on the 1 hour chart, that's the 127% Fib extension, and at the same time the ES retraced to and bounced off the 100% level.
 
i wasn't short chalky i was long and now im pi**ed i didn't trust my own signal:mad:

Having any open positions just prior to NFPs is very dangerous. Especially if you are spreadbetting without a guaranteed stop. Either use a straddle order either side of the price and cross your fingers or just sit it out and get in on the second move. I had a buy stop in at 5784.5, 7 pts away from the close at 13:29:59 and it didn't get filled until 5790. That's 5.5 pts of slippage. The safer entry was the second move at 13:34 after a small pullback. You would have entered on a higher high at 5819.5. It went to 5834.5. ie +15 pts.

Incidentally, it reversed when the ES had done an almost exact 200% extension. There's no point watching the FTSE at this point for the reversal. You'll get the signal off the ES, after all it's their Non Farms.

I am now expecting a fairly quiet afternoon session. I can't see it retracing back down to 5786. The data was very good. Equally, it's already very toppy, but it may make a move up to 1350. It is friday though and the ES is already up 1%.

martin, my system called the long some time ago i didn't take the signal it's my loss ....in certain markets nfp does not bother me this was one of them but i let it enter my head and sway my decision so missed the trade.i really do trade without news i have the squak thing but i never use it cause it interferes with my thinking. a few years ago i used to get market news letters and e mail from the market guru's but i had to stop them all for the same reason. ....strange but true:)
 
yeehaw, new highs coming in next few weeks.
Highs on the stock market, recession in the real world.
 
Dan sorry for the late reply, I wasn't around much yesterday afternoon.

I use Fibs on both the 1 hour chart and the 5 minute chart. I only look at the futures chart, but the cash chart comes reasonably close. I trade short term time frames, but the longer term helps me with overall bias.

For the 1 hour chart, the FIB extensions of 127% and 161.8% are used a lot. You need to be aware when the price reaches these levels. To get these numbers place your 100% and 0% on the swing high and low of the last 24 hours and possibly longer if no obvious turning points. If the move is lacking in strength it will retrace only 50%, 61.8% or 78.6% before turning and going back down to the 0% line.

In a really strong trend, ie ones that have had 161.8% extensions or more, they tend to only retrace to 38% before going back and retesting the highs.

On the 5 min chart, I still use Fibs but mostly the 50% and 61.8% lines, and I use the high and low of the first 1 to 2 hours for the 100% and 0% lines.

How you trade these levels is up to you. But to enter at a level I look for some kind of confirmation that it has bounced off that level before entering. I don't enter exactly at the number. But I will close trades at the number or possibly a few ticks shy of it to lock in a profit.

The pros use Fibs, so don't ignore them. Be aware of them.

Thanks alot (y)... Il do some more research on them, i have a few e-books on fibonacci i havent had chance to read yet...
 
Tell me about it... The FTSE was over 100 Points up today and I only managed to capture 20 of them... I closed my trade about 10 minutes before the 13.30pm big jump (n)... But i suppose its deffinately better than a loss

I missed it, too. Didn't make 20 points, either, because I had other things to do.
 
Top