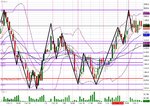
Anyone scalping the FTSE Futures??

in for sell 5519, out 5499 (stop hit) +20
failed pivot @ 5530, stoch cross on 5 min chart
 
Last edited:
must admit.. I dont like the way it is still hovering over fridays high.. we need to see a keen break of this price
 
That last thrust up may mean we are not done yet. I still think we are going down but there is no point enforcing my will on the market it will do what it wants to.

Yes, Ransquawk is down for me, but thats because I am just a retail punter and they want us to pay for the service. Understanding really. They are relaunching their website today, so if there are any problems with the retail crowd they are not too worried. At £300 per month it is too expensive for me. Shame. I really appreciate even the delayed feed.

The live text feed is very good. That's £20 per month.
 
Mark - when you say text feed, that's the Ransquawk web page headlines? Not text to a mobile? £20 per month I can live with.

Looks like we are in a tight range for now while the market decides if it can go up and retest the highs. The ES tested 1134.5 three times, so it doesn't want to go down for now, but also it is very reluctant to go up. I think we will see 5506 again on the FTSE, and possibly 5521. 5540 is the 161.8% extension off wednesdays high. If it gets near this, then I would be very tempted to go short.
 
Was that just a breakout at 11:35am, or was there some euro news that spooked the market. I see the ECB's Noyer made some comments at 11:37am so maybe it was an itchy trigger finger. Yet again!
 
Was that just a breakout at 11:35am, or was there some euro news that spooked the market. I see the ECB's Noyer made some comments at 11:37am so maybe it was an itchy trigger finger. Yet again!

rumour that wed summitt will be delayed
 
Mark - when you say text feed, that's the Ransquawk web page headlines? Not text to a mobile? £20 per month I can live with.

Looks like we are in a tight range for now while the market decides if it can go up and retest the highs. The ES tested 1134.5 three times, so it doesn't want to go down for now, but also it is very reluctant to go up. I think we will see 5506 again on the FTSE, and possibly 5521. 5540 is the 161.8% extension off wednesdays high. If it gets near this, then I would be very tempted to go short.

Yes the live text feed on the website. To be honest i would frequently turn off the audio as i found it hard to concentrate.
 
Yes the live text feed on the website. To be honest i would frequently turn off the audio as i found it hard to concentrate.

Thanks Mark. They just announced that they have been having technical problems with the relaunch of the Ransquawk website today. Let's hope they get it all fixed.

1234.50 support on the ES got broken in that surprise move down. It is retesting it now. If it breaks up through it, then that news will be forgotten, and it should retest highs. Cable is also up against a trendline and is poised to break upwards. It is lunchtime too which is not a great time to enter trades. Could go either way right now.
 
I found a simple way to prevent viruses is to go into windows msconfig and disable auto start programs in "startup", this means if u get a virus and restart the PC the virus cannot startup without some deliberate action from you.

Also there is a free/simple program called hijack this, it has a "spectacular" editors rating on cnet it can do a pc scan in about 5 seconds and produces a log which u can have analysed on many website to identify bad files.

Trend Micro HijackThis - Free software downloads and software reviews - CNET Download.com

SD and JD - Thanks for the advice. I am trying not to do too much computer stuff right now, as I just want to get on with trading. I will tackle this again when I am in need of a migraine. Any time I try something different on the computer, it opens up another can of worms elsewhere. For now everything working ok, but for how long........
 
Hi Martin
what we should have had this week on FTSE is SS,S,B,S,SS what we got was SS,S,S,S,B the pattern being complete refers to a higher high than wednesday which should have come thursday but instead came friday

The FTSE was in perfect position this week to go for the lows but the DOW has not played ball the 11898 target was negated but its like those that are buying wernt happy with 11680s they want 11880s

this has had the effect of moving everything forward three days but has not altered low targets infact puts us right on tuesday for some down which somebody mentioned the 25th I think as a cyclic day

for me this week I will be selling Monday in the 5504 to 5520 area and holding for at least 5089 only a price above 5561 would alter my outlook

I am looking at my 1 hr chart trying to match it with your observations of the trading patterns. You said that last week the pattern was SS, S, S, S, B. Does each letter reflect a 24 hr period or just a swing move from a high to low or vice versa? If each letter reflects a 24 hr period, then I don't understand the subtleties as to what each day is. If SS is monday, S is tuesday, S is wednesday, S is thursday, B is friday, then how can tueday be a Sell day when it clearly went up so much.
 

Attachments

  • 21 Oct 2011 1 hour chart Taylor Patterns.jpg
    21 Oct 2011 1 hour chart Taylor Patterns.jpg
    257.4 KB · Views: 121
The number to watch is 1249.00 on the ES. That's 161.8% extension of todays price action. Also everyone and his dog is looking to go short at 1250. There's no way even the big boys could force it up against a tide of selling. They don't need to take the fight on. They have other ways of cheating us of our money. And maybe get there at 4pm before europe settles up in the cash close. After 4:30pm it should go down, but only if the price action supports it.
 
absolute classic day on the FTSE and we know what comes next

question is
is your preference to break high 5579 to short

or gap down -65 @5458 then run
 
absolute classic day on the FTSE and we know what comes next

question is
is your preference to break high 5579 to short

or gap down -65 @5458 then run

My preference is for a bounce off 5640 cash, 5620 futures, and then finding support around 5420. And then for all the european politicians and central bankers to get trapped in a lift until 2012.
 
I am looking at my 1 hr chart trying to match it with your observations of the trading patterns. You said that last week the pattern was SS, S, S, S, B. Does each letter reflect a 24 hr period or just a swing move from a high to low or vice versa? If each letter reflects a 24 hr period, then I don't understand the subtleties as to what each day is. If SS is monday, S is tuesday, S is wednesday, S is thursday, B is friday, then how can tueday be a Sell day when it clearly went up so much.

Hi martin
a sell day can also come after a ss day and its typical to see three or four hits around the same price this was tuesday wednesday should have broke those low prices and produce a buy
wednesday was a re short day into exit thursday then buy on friday
 
Back
Top