A Professional Approach to Trading Futures

steven46

Active member
Messages
147
Likes
18
Hello Everyone

I started another thread whose title is "Beyond Price Action"
as a trading journal.

I noticed that there were very few inquiries

I have been trading professionally for about 15 years

My background is diverse, with emphasis on Math (Statistics)

I have used the same tools for many years.

Volume Profile
VWAP
Analysis of Price Action

I hope struggling traders will take a look
and perhaps find something that they can
use to improve their results.

I did this to honor the memory of the gentleman
who trained me. I think he would be proud of my
work and my progress.

Good luck in the markets
 
I am located on the West Coast UsA

and in this instance it is often the case
that I will trade the London Open, because
it is possible to see profit taking at this point
in time

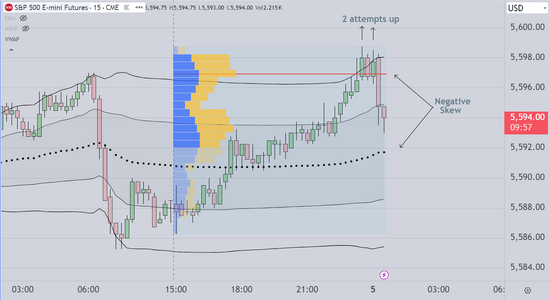
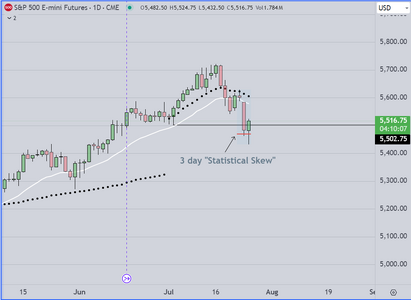
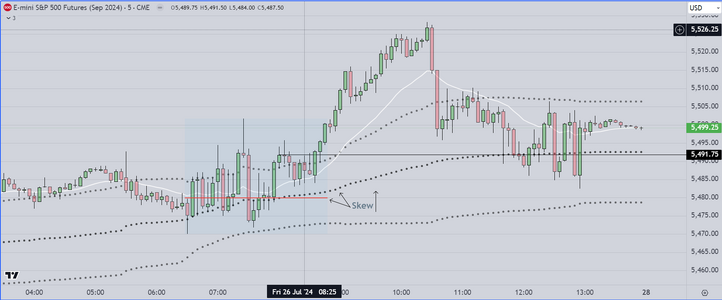
The chart attached below shows the basics
A VWAP envelope, and we add a fixed range
volume profile indicator. Our primary signal
originates from the "Statistical Skew", which is
the relationship between the POC and the VWAP
(the black dotted line). In this case that relationship
is negative, meaning that the odds favor price moving
back into the high volume area below

We also take note that at the top of the distribution
price tries twice to breakout long, and fails. This tells
us that the odds favor a short entry.

A short entry resulted in what professionals call a
"standard scalp"
 

Attachments

  • London Open Example.PNG
    London Open Example.PNG
    89 KB · Views: 22
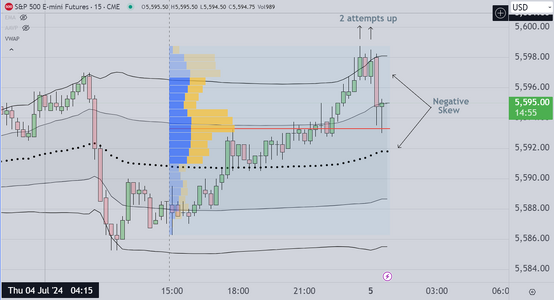
and this follow up showing a reversal
as the algo programs kick in

Notice that they activate AT the POC
Again professionals (human traders
who actually make a living) anticipate
that this is probable and we know to
"go with" to pick up few extra points.
 

Attachments

  • Reversal at POC.PNG
    Reversal at POC.PNG
    90.4 KB · Views: 15
I am located on the West Coast UsA

The London open is 8am GMT so if that is the case then are you trading at midnight your time and if so how long before you go to bed ? Also what charting package are you using ?
 
Last edited:
Hello Trader333

Thanks for your important question

I adjust my sleep schedule depending on my "read" of the current economic news
in UK and how it may affect the range (volatility) I use the weekly VWAP to help me
to anticipate when a strong move might occur. I don't recommend it to everyone, in
fact medical professionals say that getting enough sleep is critical to performance
and to health in general., so in the near future I will choose one (1) market and concentrate
on that alone. To answer more directly, I wait to see the US open. If it seems to be
a trading range open. I go to sleep and revisit the market about 4 hours later.

I use several trading platforms. Tradingview is what you are seeing on my chart posts
To me they are very similar and I don't have a favorite.
 
Last edited:
By the way folks, now that Mr. Starmer and his Labour Party are in control,, one assumes
that there will be some change in monetary policy (among other things).

The same thing may happen in the next few months in the US and we think it will be
quite an opportunity for skilled traders
 
Hello Everyone

I started another thread whose title is "Beyond Price Action"
as a trading journal. . .
Hi Steven,
Just curious as to the difference (if there is one) between this thread and your existing 'Beyond Price Action' thread? Perhaps this a continuation of that thread - part 2 as it were - or are you intending to take it in a different direction?
Tim.
 
I simply wanted to bring the content of the original thread to the attention of folks who
trade Index Futures

As mentioned, although there were many views of the thread, there were no substantive
questions, therefore we assume everyone had sufficient background to understand how
the tools of the trade are being used.

At this point we are 1) training fund hires (periodically) and trading our own money
to add posting at T2W becomes difficult. Since we have essentially fulfilled the
obligation that brought us here in the first place, this may be a good place to stop.

I think traders who have the right background should be able to create a reasonable
system of their own.
 
Local time at my location is 4:52 PST (West Coast USA). The S&P opens in about 90 minutes

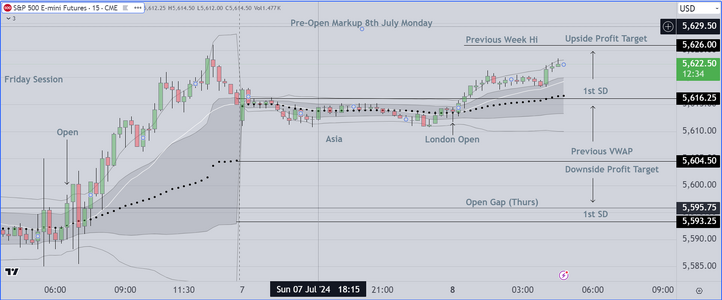
Attaching an example of the chart markup I use

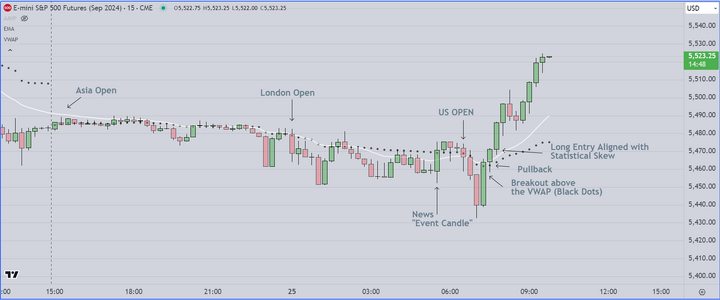
Because Asia (and London) opened in proximity to the all time high, I took the opportunity to
trade London's open. In this context (when we are close to an all time high, or to any "Key Reference"
odds favor a test of that area. From our perspective it is easy money to pick up. The trade starts to
setup about 30 minutes prior to London's open. On the 15 minute time frame you can see the
move up, followed by a pullback. Once that pullback completes, the Algo's are activated and
human traders also start to build positions. Entry was at 14 (approximately) and as of this time
skilled traders would start to exit (taking some profits at +10 pts). Some of course would stay the course
hoping for a net positive open of the US session.

Added Postscript

A couple of minutes ago the CFD's high an all time high (according to my news feed). The title of
that news feed was "Britain under new management".
 

Attachments

  • Pre-Open Markup Example 2.PNG
    Pre-Open Markup Example 2.PNG
    144.8 KB · Views: 12
Last edited:
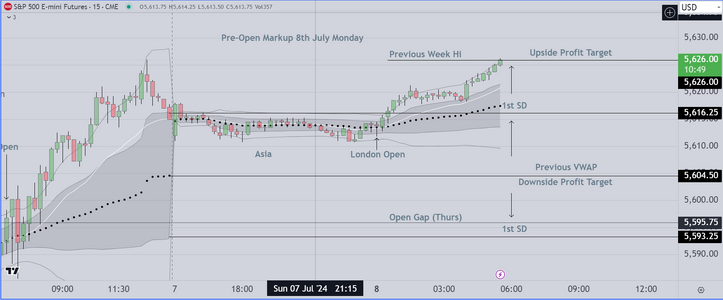
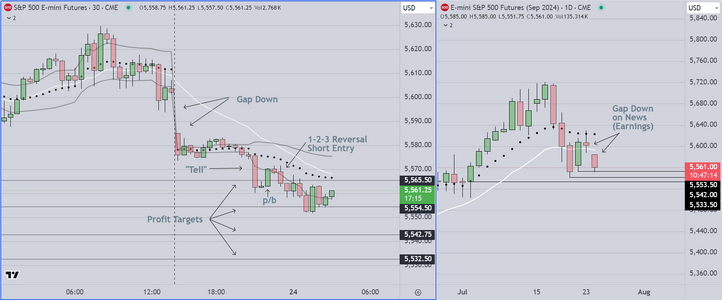
And this last chart for today

I had to move the text over a bit
so that one could see the upside target
hit at 26

As I have mentioned previously I adjust my
sleep schedule so that I can trade these
kinds of opportunities. I will watch the US
session open, looking to identify a possible
reversal.

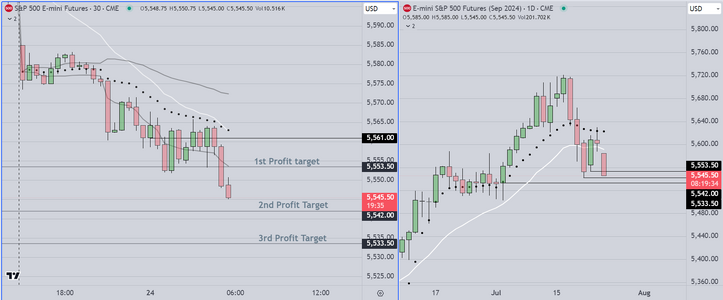
The scenarios for today (in my opinion) are

1) Breakout to the upside followed by a retest of
the all time high, and continuation up
2) Reversal to the downside, followed by retest of the all time
high, and then continuation to the downside targets
shown on the chart
3) Trading range, sideways trading in anticipation of
economic news
a)Fed Chairman Powell on Tues
b)and more from the Fed on Wed

Markets will be moved by inflation comments and data,
and Bank Earnings. I will be marking the "event candles"
and trading those reactions (as I have mentioned previously)
 

Attachments

  • Chart Example 2.PNG
    Chart Example 2.PNG
    132.2 KB · Views: 16
Last edited:
I have been asked to train another
group of fund hires, so (again) this will
be the last post for a while

I though I would show an example
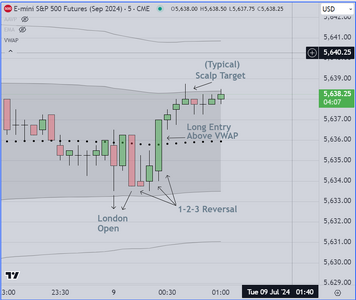
of what I call a "1-2-3" Reversal
on the 5 minute time frame

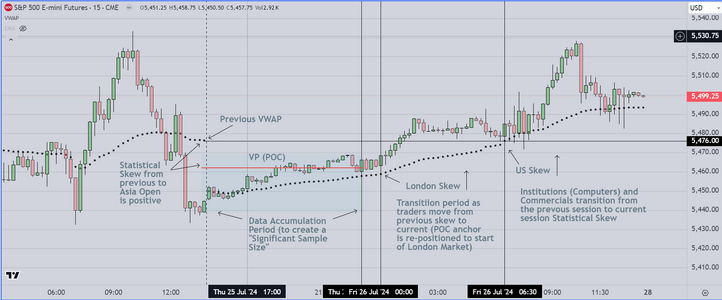
The important things to notice are
as follows

1) London Opens and there are two (2)
unsuccessful attempts to move down
2) Price is positioned at the lower region
of the VWAP envelope, close to the 1st SD
3) Price creates a 1-2-3 reversal
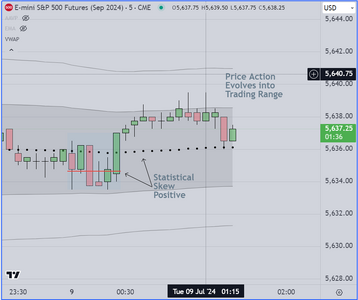
4) The "Statistical Skew" is positive, indicating
a tendency for price to move into the higher
volume region overhead (see 2nd chart)

There is (much) more that can be said about the
"1-2-3" pattern, but I don't have enough time
to go into the details.

Long entry occurs as price moves up past
the VWAP median. If there were a "textbook"
on the subject, this would be the typical
example., with entry just above the VWAP
median, and profit taking at the opposite
1st SD band.

A couple of final thoughts as follows

Using these framing tools, professional
traders can decide in advance, whether
the risk is worth it to take the trade. In this
case the odds favor the move up, even
though the scalp is a small one (2 pts))
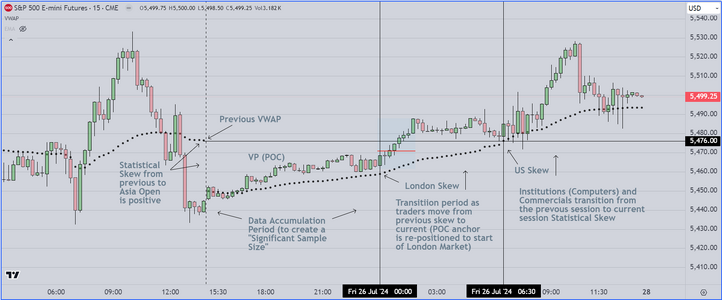
as seen in the 2nd chart, price evolves
into a trading range, which is also typical
for a session where Fed (Powell) will comment
for two (2) days.

So the overall strategy is to wait for what we
characterize as "event candles", to mark and
trade per our previous posts.


Good luck
 

Attachments

  • Typical Scalp Example.PNG
    Typical Scalp Example.PNG
    71.6 KB · Views: 10
  • Trading Range Example 2.PNG
    Trading Range Example 2.PNG
    63.2 KB · Views: 9
Last edited:
Top