3rd generation NN, deep learning, deep belief nets and Restricted Boltzmann Machines

So actually how do you model the time series ?? Using RBM ?? I think RBM was designed
for static picture recognition not dynamic time series. Or maybe you just feeding nets with static picture of the pattern ??? But in this case all info about dynamics of time series is lost.

Do you measure any error of recognition ?

Krzysztof

That’s my point. The net is a classifier and to make it dynamic it is trained on new bars. I am not aware of an efficient online training algorithm that would do that. It currently works but it is not practical mostly because it is very slow to converge.
 
No.

Let's say you have a bad knee. You can see a number of different types of specialist and depending on the area of specialisation, you will either have a muscle problem, bone problem or even immune system problem. Therapy will be physio, drugs or operation.

What you won't get much of is "this is not within my area of specialisation". After all, if the only tool you have is a hammer...

And so it comes to trading. Take someone with a background in statistics and they will probably use statistical models. Take someone with a background in programming and they will be writing strategies based on existing specifications (i.e. trading books). Take someone with a background in Neural Nets.....

So - this is more of the same. Attempting to use knowledge gained outside of trading within trading. Trying to apply your own comfort zone where you are not comfortable.

Ultimately - if you want to make money trading, you have to learn how to trade yourself. If you can't do that, you have zero chance of getting a computer to learn for you.

Totally agree. But convene that there are useful tools out there. Hypothetical Joe the trader was doing very poorly the other day. Markets were so fuzzy until he realized that he did not have his glasses on. He is not an optometrist himself but he now knows that wearing glasses can really help in his case.
 
That’s my point. The net is a classifier and to make it dynamic it is trained on new bars. I am not aware of an efficient online training algorithm that would do that. It currently works but it is not practical mostly because it is very slow to converge.

Well, than perhaps you should read this Phd

"Composable, distributed-state models for high-dimensional time-series" from

http://www.cs.nyu.edu/~gwtaylor/

Here is a video lecture where Hinton refers to this paper and describes how it works


Implementation of this Phd is one of the goals of this thread - see 1st post.

So do you measure accuracy of your current prediction or pattern recognition somehow ??

Krzysztof


I have experimented with the dynamic models from Graham. They are shallow nets though. They are not deep structures (2 layer dynamic CRBMs at most). So I have added layers which is allowed in theory but did not get any useful structure from the latent variables.

Accuracy wise? It depends. Detecting cycle shifts for example is close to 100% at completion. Usually I don’t wait full completion. 60% completion gives me about 70% accuracy. The shift of cycles to a larger time-frame appears to not be ambiguous in most cases and it seems to not depend on the instrument either. But choosing the patterns randomly leads to accuracies no better than chance. A lot of care is required in selecting the data to train the net on. It’s a general rule about nets when applied to markets I think. The naïve approach to feeding them with streaming market during training data does seem to work. I guess this is because there is no clear manifold to rely on.

Did you try FCRBM also ?? Any better luck ??

A lot of care is required in selecting the data to train the net on. It’s a general rule about nets when applied to markets I think.

How to select the proper data for training ?? By knowing this we know which patterns will
occur in the future we are immediately the winner i think.

How do you convert output from you cycle indicator to binary values or probalilities
as it is required by RBM ?? maybe there is a possibility to improve.

Krzysztof
 
Hi, I saw this thread referenced somewhere else and was intrigued because I'm interested in some of the mathematically interesting quantitative methods.

However, I'm quite skeptical of the utility (at least at first) or wisdom of the more sophisticated machine learning methods for trading before the fundamentals are adequately addressed. I'm not an arrogant person generally, but I'll have to assert some (unproven) credentials here: this is an area where I do have some experience; it is my "day job", and I do predictive analytics commercially (non-trading related) for a successful product, and have a significant academic background in nonlinear signal anslysis.

Before jumping into the deep (and fun) end of neural networks/SVN's and now the new hot thing of back-to-very-deep-neural-networks, we need to adequately define the mathematical problem.

Critically, we need to define---in an insightful, problem-specific way---(a)what we are measuring, (b) what we are optimizing, and (c) how do we know when it's working or not? And only AFTER those are adequately defined and tested, do we start choosing classifier/estimator architectures & algorithms.

This may sound facetious but it actually isn't: have you tried linear regression? (*see below)

It is really critical to define both the target function (what do we optimize, and why?) properly for the problem, and the most underappreciated issue: over what ensemble (probability distribution of examples) are we training---and---measuring performance?

Often people don't think about this, they use the "convenience ensemble" without knowing any better: they collect all examples which are possible to collect, and then weight them all uniformly, and implicitly assume the test condition will be the same.

In trading it might be like collecting examples at fixed time intervals where data exist and making an "up-or-down" hard binary or soft binary prediction. OK, that's a start, but as trading that may be assuming a system where you have to be either long or short at every possible open trading hour. I don't think that's appropriate or likely to be successful. What is something really good for this problem? (I don't know personally).

Then, if you have a good target criterion suitable for the problem, how are you checking your success? Critically important is doing proper cross-validation (permutations of train/test sets) and making sure you don't have time-based correlation or target leaks across train & test. To be serious you should be also creating time-series of "surrogate data" from stochastic processes with similar behavior (e.g. GARCH conditional heteroskedastic models for finance) but no predictability to make sure you aren't able to spuriously learn something on these.

It takes quite a bit of thought and effort to get there---and I think we ought to start with the simplest classifiers at the core (linear & logistic regression, which can be learned quickly & determinstically), because the problem set up is hard enough.

When I say linear regression, I mean linear regression with proper normalization of inputs and, crucially for this problem, good input selection and regularization (ridge and/or lasso regression), with regularization parameters selected say by cross-validation experiments.

Only after you get a positive result with such simple methods (and this may mean feature creation) might it be worth going to the next level of nonlinear predictors. A former colleague who previously worked in a hedge fund said that any profitable strategy had to be reasonably simple and first work first with linear regression (or be visible with simple correlation in the right space). Sophisticated methods may squeeze a bit more performance out of the phenomenon but you had to get somewhere with simplicity.

No, I unfortunately don't have any answers or practical insight and probably sound like a cranky old fart. I guess my goal is to redirect the locus of thought and attention to thinking through some foundational issues which I feel are very important.

On the sophisticated "deep belief networks", etc: the researchers there are attacking core artificial intelligence problems where there exist numerous examples of skilled and effortless natural (biological) classification but computers find hard. (a breakthrough in A.I. is cognition of a two-year old chimpanzee). Trading isn't like this---signals are mostly noise and even smart humans don't regularly succeed. There's a general rule of thumb: the higher dimensionality of the problem and the higher the noise level, the more like a linear system it is.
 
Let me quote StratOpt

There is absolutely nothing wrong with curve fitting. The only danger in optimizing is if you allow an overfit. Optimizing is only one part of a testing equation. In all reality, If you develop a strategy of any kind and it has a parameter or any other rule in which you make a choice as to what setting or rule to use then you have already curve fit before you begin any optimization. So yes you are curve fitting and yes genetic optimizers are a "fancy" way of doing such, and yes that is what they are designed to do. Again, there is nothing wrong with any of that. I have been very successfully incorporating such things into my development and testing and trading for quite a long while now and can't imagine not using them and remaining successful with any sort of programmatic strategy trading.

http://www.trade2win.com/boards/tradestation/101792-ts-add-ons-strategy-development.html#post1229142

Any trading system that contains at least one parameter that needs to have its value selected will fail in actual trading because of curve fit (I am not talking about optimum curve fit). Any fitted system will fail, most of the times very fast. You should be able to distinguish reality from a sales pitch.
 
Hi, I saw this thread referenced somewhere else and was intrigued because I'm interested in some of the mathematically interesting quantitative methods.

However, I'm quite skeptical of the utility (at least at first) or wisdom of the more sophisticated machine learning methods for trading before the fundamentals are adequately addressed. I'm not an arrogant person generally, but I'll have to assert some (unproven) credentials here: this is an area where I do have some experience; it is my "day job", and I do predictive analytics commercially (non-trading related) for a successful product, and have a significant academic background in nonlinear signal anslysis.

Before jumping into the deep (and fun) end of neural networks/SVN's and now the new hot thing of back-to-very-deep-neural-networks, we need to adequately define the mathematical problem.

Critically, we need to define---in an insightful, problem-specific way---(a)what we are measuring, (b) what we are optimizing, and (c) how do we know when it's working or not? And only AFTER those are adequately defined and tested, do we start choosing classifier/estimator architectures & algorithms.

This may sound facetious but it actually isn't: have you tried linear regression? (*see below)

It is really critical to define both the target function (what do we optimize, and why?) properly for the problem, and the most underappreciated issue: over what ensemble (probability distribution of examples) are we training---and---measuring performance?

Often people don't think about this, they use the "convenience ensemble" without knowing any better: they collect all examples which are possible to collect, and then weight them all uniformly, and implicitly assume the test condition will be the same.

In trading it might be like collecting examples at fixed time intervals where data exist and making an "up-or-down" hard binary or soft binary prediction. OK, that's a start, but as trading that may be assuming a system where you have to be either long or short at every possible open trading hour. I don't think that's appropriate or likely to be successful. What is something really good for this problem? (I don't know personally).

Then, if you have a good target criterion suitable for the problem, how are you checking your success? Critically important is doing proper cross-validation (permutations of train/test sets) and making sure you don't have time-based correlation or target leaks across train & test. To be serious you should be also creating time-series of "surrogate data" from stochastic processes with similar behavior (e.g. GARCH conditional heteroskedastic models for finance) but no predictability to make sure you aren't able to spuriously learn something on these.

It takes quite a bit of thought and effort to get there---and I think we ought to start with the simplest classifiers at the core (linear & logistic regression, which can be learned quickly & determinstically), because the problem set up is hard enough.

When I say linear regression, I mean linear regression with proper normalization of inputs and, crucially for this problem, good input selection and regularization (ridge and/or lasso regression), with regularization parameters selected say by cross-validation experiments.

Only after you get a positive result with such simple methods (and this may mean feature creation) might it be worth going to the next level of nonlinear predictors. A former colleague who previously worked in a hedge fund said that any profitable strategy had to be reasonably simple and first work first with linear regression (or be visible with simple correlation in the right space). Sophisticated methods may squeeze a bit more performance out of the phenomenon but you had to get somewhere with simplicity.

No, I unfortunately don't have any answers or practical insight and probably sound like a cranky old fart. I guess my goal is to redirect the locus of thought and attention to thinking through some foundational issues which I feel are very important.

On the sophisticated "deep belief networks", etc: the researchers there are attacking core artificial intelligence problems where there exist numerous examples of skilled and effortless natural (biological) classification but computers find hard. (a breakthrough in A.I. is cognition of a two-year old chimpanzee). Trading isn't like this---signals are mostly noise and even smart humans don't regularly succeed. There's a general rule of thumb: the higher dimensionality of the problem and the higher the noise level, the more like a linear system it is.

Welcome to the thread.

Regarding fundamentals. I believe they are properly addressed, some people on this thread has quit much experience from research plus some necessary experience from TA and strategy development. Beside this we are basing our project on the system made by the University of Columbia (see 1st post) so hopefully they knew what they were doing :innocent:

I'm attaching some descriptions of this system

Regarding linear regression. Maybe there are systems which makes money using it
but personally i doubt...maybe 20 years ago...but SVM with linear kernel suppouse to work the best....

Krzysztof
 

Attachments

  • TradeFX.zip
    4 MB · Views: 390

Attachments

  • guide.pdf
    290.4 KB · Views: 2,771
Welcome to the thread.


Regarding linear regression. Maybe there are systems which makes money using it
but personally i doubt...maybe 20 years ago...but SVM with linear kernel suppouse to work the best....

Krzysztof

SVM with linear kernels are typically used for binary classification problems (target is +1/-1, instead of a continuous value). (Linear kernel is "no kernel", really).

It is virtually no different from "logistic regression" which is the natural analog of linear regression with categorical instead of continuous targets. There can be minor technical details in terms of the loss function. Cross entropy/Bernoulli likelihood is conventional for logistic regression whereas other loss functions are conventional for linear SVM's, but I've seen pacakges---maybe even LibLinear---which offer all of them.

It's really all the same thing: linear SVMs are just a convenient way to do regularized linear binary classification. And that can take you pretty far---that's my point!

This is most definitely a linear prediction, and this can be pretty powerful if you craft good, probably nonlinear inputs. Linear classification doesn't mean that you're assuming a linear Gaussian stochastic process (which is unquestionably untrue), that's something different.

Making money requires insight first (human learning), then machine learning.

I looked at the powerpoints in the attachment. My observations: (a) this is a very naive undergraduate project (b) a linear model "won".

Let's move on. We may be able to do better. How should we answer these questions:

What do you think the right target function should be?

What are the training and evaluation criteria?

How do we know we have something good?

Does the model make sense?

How should the inputs be normalized? How should we do input selection ?

Given a classifier's score, what is the right strategy?
 
Last edited:
Nice to hear from you. Regarding your questions:

What do you think the right target function should be?

Target function is a trade result here: positive or negative.

What are the training and evaluation criteria?

Evaluation is done OOS. He is extracting features from price using TA indicators e.g.
like this

Code:
cond(1) = within(upBol,price); % within 5% of upper Bollinger band
        cond(2) = high(t) < high(t-1) && low(t) > low(t-1);%scf was high(t+1) < high(t) && low(t+1) > low(t);
        cond(3) = close(t) < open(t);
        cond(4) = trend(RSI,t,'DOWN');
        cond(5) = trend(CCI,t,'DOWN');
        cond(6) = stoch(t) > STOCH_TOP;
        cond(7) = pSAR(t) - close(t) > 0;

Those conditions are used for training. Than he calculates accuracy of prediction

How do we know we have something good?

He assumes good accuracy value = to have something good and its actually wrong

Does the model make sense?

Yes. But he made 3 errors in this system

1) in the code in a few places were future leaks i.e. he was using future data and it is not allowed
2) he didn't use stop loss and take profits
3) he used only sell orders

In real life we are not interested in accuracy but in total profit so we are interested in equity curve so stop loss must be used as a few trade can blown the account.

By using sell orders only is not possible to evaluate this system as result will depend a lot
from the current trend direction of price. Than finally futures leaks also 'overpaint' accuracy measures.

So results from pdfs are not reliable at all in my opinion. See screenschots fo this system, system was selling only against the trend and a few trades because of no stop loss killed equity curve.

How should the inputs be normalized? How should we do input selection ?

inputs are normalized as conditions are using standard TA indicators.

Given a classifier's score, what is the right strategy?

Profit and equity curve is right score not accuracy - explained above

Krzysztof
 

Attachments

  • 1.JPG
    1.JPG
    99.2 KB · Views: 1,592
  • 2.JPG
    2.JPG
    37.8 KB · Views: 1,106
Last edited:
SVM with linear kernels are typically ... How should we answer these questions:

What do you think the right target function should be?

What are the training and evaluation criteria?

How do we know we have something good?

Does the model make sense?

How should the inputs be normalized? How should we do input selection ?

Given a classifier's score, what is the right strategy?
An interesting set of questions. Perhaps we can start a discussion of each, and arrive at a conclusion. Let's try one at a time.
What do you think the right target function should be?
This is crucial, but difficult to choose. There are several general target classes that come to mind:
1. Some future value of the price stream, e.g. the next bar High, or the close in N bars. The problem here is that one must craft a system to use the prediction to maximize some function of the return series. This class of targets are system unspecific, so that they do not take some system considerations into account . e.g. sometimes predicting the close in N bars with a known mse is not enough if there are large swings in the price that would set off a stoploss in most reasonable systems.
2. The value of the return given an entry at the current bar. ( This has been reduced to a binary value in TradeFX). The problem here is that the target return depends greatly on how entry and exits are defined. e.g. in the TradeFX report several methods are to determine when an entry occurs. They all depend on a set of classic indicators (RSI,MA,CCI, etc.). The exits are defined in terms of the same conditions, plus a stoploss and takeprofit. This class seems to be overly system-specific, so the system better be very generic, or very sophisticated. TradeFX is neither.
3. The price stream that should be traded. e.g. given the various FX pairs, which one is most likely to give a positive return in the near future. This is also system specific, but is probably required for a complete system approach.

It's pretty clear that one must take into account such things as the goal of the classification. e.g. are we trying to design a system to trade trends?, breakouts?, maybe scalp?, possibly to hedge one pair against another, or basket trade.

In the long run, one should probably iterate between these target classes to arrive at a suitable system.

Please add other categories that you have in mind, and give us your opinion on which makes most sense.
 
Class problems require
transformation of raw data into 'feature space'
transformation of feature space into (usually higher dimensional) decision space
placement of hyperplane in decision space to make decisions
In this sense all classification problems can be solved with a linear classifier.

The hard part is to find the transformations from data space to feature space and from feature space to decision space. The reason I split this into two transformations, though one would do, is because most problems are solved with this two-step process. When we try to use 'indicators' to make entry/exit decisions, we have implicitly used the indicators as transforms from raw data to decision space. This usually doesn't work well, or we would all be rich.

When we train a neural net, or use KNN, or SVM, etc on indicators, we use the indicators as the first set of transforms, and use the net, etc. to find the second set of transforms. For this process to be successful, we must have first selected appropriate indicators. Else we require the net, etc to 'undo' the indicator transform and redo it properly. If the first set of transforms has destroyed information, then the second set cannot ever do the job right.

Since we know algorithms to search for the appropriate transforms (backprop, QP, etc), it makes sense to avoid indicators, and search for the transforms using raw data as the input. So let's ignore indicators for a while, and work with the raw data in a price series. This data arrives as either 'tick' data or 'bar' data. It is hard to obtain historical tick data, so we are sort of stuck with bar data. Using 1 minute bars is probably not too bad, since the range in 1 minute is usually pretty small.

Bar data is 5-dimensional when history is ignored. The volume dimension is questionable when the data comes from many brokers, but maybe OK coming from a large ECN. The historical relationship of close and next bar open means that the raw data is really only 3 dimensional + volume. This is not enough to make good decisions. The past must be considered. So it seems reasonable to take as raw data a window of bar data.

But this data is notoriously non-stationary, since e.g. it trends. So we need to make some simple transform to introduce at least quasi-stationarity. First differences of OHLC are quasi-stationary in the sense that the mean and stdev are relatively constant over relatively long periods. An alternative is %change, which is closely related, and perhaps more stationary. It would also be reasonable to use detrended data (e.g. x - SMA(x)). None of these destroy information as so many indicators do.

So the first transform is to difference the data. Now we search for transforms on windows of differenced data that will allow linear seperation. This brings us to my reason for joining this thread. Deep Belief Networks seem to have the ability to find features using unsupervised learning. Although they were suggested by models of the brain, that has nothing to do with their value here. In a search for transforms of raw data to features we need something that will operate without supervision, essentially because we don't know just what a good feature is. We do know what a good decision is..or at least we must know before we can design a system, but because the feature-transform is into a high dimensional decision space where we can place a hyperplane to get a decision, we don't know how to characterize the 'goodness' of a feature transform. It seems to me that the unsupervised learning capability of DBN's may help select good features. It is that aspect of these that I wish to explore.

That said, the TradeFX framework has been useful, just to show some of the difficulties of 'indicators' as features. It is indeed a naive undergraduate project, and fraught with errors, but it demonstrates the futility of using classic indicators (MA, MACD, RSI, CCI, etc) with powerful search algorithms like SVM. The SVM cannot undo the damage done when the raw data was converted to binary-valued features. The best case here is called pipmaximizer. That uses 9 binary-valued features called conditions. The total input space is restricted to 512 points. It is not likely that those points contain enough information to make trading decisions. Furthermore, information has been irredeemably destroyed by quantizing the indicators. However, it might be possible to use a window of the binary data to find a good decision space. Since RBM's require binary input data, it might be useful to use a historical window of the conditions as input to an RBM.

However, I believe that a better approach will be to use a historical window of differenced HLCV data as an input to a CRBM....

All of which leaves the decision as to just what to optimize. Any ideas?
 
Slightly tangential here, but I thought it worth asking since there are clearly a lot of rigorous/inquiring minds contributing on this topic.
(i) Although you are discussing Neural (and I use the term Neural broadly) predictive systems, are any of you using brute force statistical / empirical studies against simple hypotheses? Or, if you posited/discovered some tradeable black box phenomenon (ie something predictive and tradeable, but whose explanation escapes you, or is difficult to prove), would you trade/advocate it on that basis alone?
(ii) within Neural systems generally, if you're successful, would you expect to understand how the system works? My grasp of what you are discussing is primitive, but I had always understood that successful NN systems are difficult to rationalise/understand. Is it plausible to form an intuitive (if not explicit) understanding of how a Neural system is operating?
 
An interesting set of questions. Perhaps we can start a discussion of each, and arrive at a conclusion. Let's try one at a time.
What do you think the right target function should be?
This is crucial, but difficult to choose. There are several general target classes that come to mind:
1. Some future value of the price stream, e.g. the next bar High, or the close in N bars. The problem here is that one must craft a system to use the prediction to maximize some function of the return series. This class of targets are system unspecific, so that they do not take some system considerations into account . e.g. sometimes predicting the close in N bars with a known mse is not enough if there are large swings in the price that would set off a stoploss in most reasonable systems.

Perhaps something like a short term Sharpe, or moments of positive returns over some period minus moments of the negative returns?

Please add other categories that you have in mind, and give us your opinion on which makes most sense.

Here is my bias---without experimental experience.

I think it would be more stable to attempt to predict some functional of the future price---and also be able to emit some estimate of "how sure I am about this predcition". (it's not obvious to me how to do this) This function requires human thinking.

Then, assuming that one could make predictions of this phenomenon with a certain degree of confidence, generate trading rules. The rules ought to depend on the functional being traded.

For instance, if you're executing a trend following system, then you want to trade when there is a strong predicted trend, and the predicted variability about this (aka security in the prediction) is small.

If you're selling options, then you want to enter a trade when volatility is presently high and is predicted to decrease. This would be a different function to be machine-learned.
If you're buying options (equivalently a breakout system) you want to initiate trades on the opposite scenario.

I don't know about how to model exits.

The issue is that actual trading results are going to have an enormous amount of noise, and it may be unfeasible or unreliable to try to estimate parameters for such a system directly.
 
Slightly tangential here, but I thought it worth asking since there are clearly a lot of rigorous/inquiring minds contributing on this topic.
(i) Although you are discussing Neural (and I use the term Neural broadly) predictive systems, are any of you using brute force statistical / empirical studies against simple hypotheses? Or, if you posited/discovered some tradeable black box phenomenon (ie something predictive and tradeable, but whose explanation escapes you, or is difficult to prove), would you trade/advocate it on that basis alone?

Maybe, but it depends on how well the model was trained, and how confident I am in its robustness, e.g. did I do significant regularization & cross validation? How big a space did I search in blindly to estimate a model---the bigger the space the more skepticism.

Also, given a trained model, one should try to analyze it and see the most important inputs---or combinations of inputs which could give you insight into the basic behavior even if the details are complex. Alternately, look at the inputs which are typical for each positive/negative/neutral class.

(ii) within Neural systems generally, if you're successful, would you expect to understand how the system works? My grasp of what you are discussing is primitive, but I had always understood that successful NN systems are difficult to rationalise/understand. Is it plausible to form an intuitive (if not explicit) understanding of how a Neural system is operating?

By "neural" I assuming a multi-layer perceptron. Not without a bunch of work and likely approximating the function with easier to understand functions.
 
Class problems require
transformation of raw data into 'feature space'
transformation of feature space into (usually higher dimensional) decision space
placement of hyperplane in decision space to make decisions
In this sense all classification problems can be solved with a linear classifier.

The hard part is to find the transformations from data space to feature space and from feature space to decision space.

Agreed.

Since we know algorithms to search for the appropriate transforms (backprop, QP, etc), it makes sense to avoid indicators, and search for the transforms using raw data as the input.

I'm a skeptical of this because of the high noise level and very high dimensionality.

I mean you can already do something dumb, and just put all your observations of a big length M vector into a PCA and extract out the principal components. They'll probably look like Lagrange polynomials (PCA on random time series), and so your features are dot-producting a few of these into history. Will this have out of sample predictive value substantially better than EMA's at various timescales? Not sure. Or what about just making some time-space to wavenumber space transform manually?

Just because it's not obvious at all what these deep networks will extract given various inputs doesn't mean that they're finding something profound. I see them used in mimicry of natural learning tasks where the inputs (e.g. from sensory neurons) are very structured because of reality of the world and sensory channels have structure.

Of course I can be wrong.

But this data is notoriously non-stationary, since e.g. it trends. So we need to make some simple transform to introduce at least quasi-stationarity. First differences of OHLC are quasi-stationary in the sense that the mean and stdev are relatively constant over relatively long periods. An alternative is %change, which is closely related, and perhaps more stationary. It would also be reasonable to use detrended data (e.g. x - SMA(x)). None of these destroy information as so many indicators do.

I think that "destruction of information" is exactly what you want to do. This is calling "information" In the information theoretical sense where a time series with maximal information generation is one with the most noise, and least past-to-future predictability.

So the first transform is to difference the data. Now we search for transforms on windows of differenced data that will allow linear seperation. This brings us to my reason for joining this thread. Deep Belief Networks seem to have the ability to find features using unsupervised learning. Although they were suggested by models of the brain, that has nothing to do with their value here. In a search for transforms of raw data to features we need something that will operate without supervision, essentially because we don't know just what a good feature is. We do know what a good decision is..or at least we must know before we can design a system, but because the feature-transform is into a high dimensional decision space where we can place a hyperplane to get a decision, we don't know how to characterize the 'goodness' of a feature transform. It seems to me that the unsupervised learning capability of DBN's may help select good features. It is that aspect of these that I wish to explore.


That said, the TradeFX framework has been useful, just to show some of the difficulties of 'indicators' as features. It is indeed a naive undergraduate project, and fraught with errors, but it demonstrates the futility of using classic indicators (MA, MACD, RSI, CCI, etc) with powerful search algorithms like SVM. The SVM cannot undo the damage done when the raw data was converted to binary-valued features. The best case here is called pipmaximizer. That uses 9 binary-valued features called conditions. The total input space is restricted to 512 points. It is not likely that those points contain enough information to make trading decisions.

I guess I have a different bias----I feel that a trading system with a simple, small dimensionality is more likely to work, or at least continue to work outside the training interval. And it takes human insight and experience to craft these features.
 
some basic tests

After some nice posts lets return to reality and check if TradeFx actually works and how it behaves in some stress conditions so trading against the patterns which it didn't learn

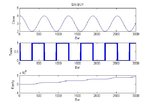
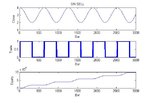
First I applied TradeFX against simple sinus series. It has quite long period but training was including three full periods.

From the screenshots is clear that it works well. Both Buy and Sell singals were generated
at the bottom and tops of sinwave.

So far so good:)
 

Attachments

  • sin_buy.jpg
    sin_buy.jpg
    31.3 KB · Views: 487
  • sin_sell.jpg
    sin_sell.jpg
    31.1 KB · Views: 524
basic tests

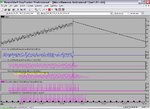
Than I applied TradeFX against more advanced signal which contains 1000 bars of
three cycles 20,40 and 100 bars + trend + noise, than it switches to pure downtrend
 

Attachments

  • gg.JPG
    gg.JPG
    139 KB · Views: 555
basic tests

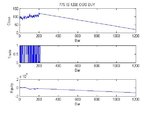
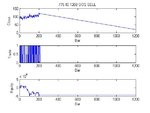
1st test was done 775 Bars trainig and 1200 Bars OOS. It means system is trained on uptrend part (1st 1000 bars) but trading on last 225 bars of uptrend and 1000 of downtrend

From the results is possible to see that:

for sell orders - sell orders were not executed during downtrend, most likely because system was trained for uptrend

for buy orders - even after switchnig to donwtrend system generate continous buy signal at donwtrend

so very bad !! (n)(n)(n)
 

Attachments

  • 775IS_1200OOS_BUY.jpg
    775IS_1200OOS_BUY.jpg
    27.3 KB · Views: 492
  • 775IS_1200OOS_SELL.jpg
    775IS_1200OOS_SELL.jpg
    26.6 KB · Views: 402
Last edited:
Top