Hi Quercus,
overtaken by events somewhat - but this does add immensely to my ability to spout off as if I knew something at the time...
First off, nothing to do with 1-2-3 originally - I was trading an earlier trend and was long, like Roberto (?) I trade when I can and frequently I have to leave a limit order and don't know squat for 6 hours or more... I set an ambitious limit that it missed, it then retraced before I knew I'd been sitting pretty - such is life!
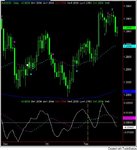
When I saw it this chart screamed out the 1-2-3 I marked. That last bar is part of a consolidation in my view - it's an 'inside day' or whatever a 10 min bar equivalent is called - and the green bar before it is within the range of the red bar third last. Following the three the second red bar is also 'inside' the first one. This gives a '3' followed by (effectively, IMO) 3 down bars worth of movement, actually 5 bars showing a tendency to consolidate a bit. I don't count that last bar as a higher low - it's inside, to my mind it isn't showing bullishness but indecision. As it's obvious that the low of that bar is indeed above the previous one I ought to explain that an inside day in my version of TA is showing a bearish top and a bullish low - it suggests the bulls and bears are enjoying what we called a "cake and a**e party' in the RAF, implying a certain lack of decisiveness and order. I think it's wishful thinking to call it a vote for bull or bear, effectively a bar to be ignored - the bulls and bears will make their minds up at some point. I would be extremely reluctant to consider it a bullish sign at the end of a downtrend... in this particular chart I'd say 'downtrend in place, rally over and done with, shilly shallying about rather than getting on with penetrating the '2' point as expected. Not bullish - at best it seemed a case of 'it ought to be obviously plummeting, instead it seems to be undecided'.
I'd call that a bearish top, with 1-2-3 heading south, and as I was looking at it (somewhat woefully, as I was long still) it seemed to me to be a pretty convincing one at that - I was actually quite relieved to be at near enough breakeven, if it weren't for an apparent reluctance to plummet in those last half dozen or so bars I'd be far worse off. I was reading the 1-2-3 thread on screen 2 at the time, and whilst trying to convince myself to exit and go short I thought I'd post the picture I was looking at - it was hard for me (psychologically) to chuck it in and go short, I held a while longer then exited in fact... I'm allergic to reversing a trade as it's too easy to whipsaw yourself far more effectively than the RSI on a consolidating share if you do that <g>
It did seem to me that somebody with less 'involvement' at the time might glance at it and go 'crikey... what a stunner' and make a few bob... people have highlighted good trades I've seen at the right time, it seemed only fair to return the compliment if only by alerting those more able than myself to the potential.
I'll check it, I'm pretty sure it went down a dollar or so today - yeah, pretty big down day to 23.05, a smallish lower shadow on that so it's a shame I was at work until almost 7pm when it was all done and dusted!
I'll call the next 3 or 4 wrong, I wasn't really looking to say 'hey this is a short' it's just I know that it's quite common to see something an hour later and think 'how did I miss that?' Consequently I thought I'd post it as a significant pattern and leave the reader to decide what to do with it.... a bit timid I know, but you could have made decent money trading opposite me for the past month!


