isatrader
Senior member
- Messages
- 2,964
- Likes
- 135
I’m starting this new thread for my active trading via my spread betting account. I will be focusing on trading the S&P 500 index, Stocks and Commodities. My goal is make 3%+ per month but risk a maximum of only 1.5% of the account a month to achieve this.
I’m a discretionary trader, so I don’t have a set mechanical system to follow, but I’ve been trading fairly actively in an ISA for the last few years and have got to a reasonable level of proficiency (see my other journal Trading in an ISA to pay off my mortgage). So I’m confident that I can continue to be profitable, and hopefully more profitable than before by trading actively with much lower costs than I’ve been able to in an ISA.
I began the spread betting account in the middle of October 2010 with £4024.61. The £24.61 was left over from 2007 when I first tried spread betting and managed to blow up a few small £500 accounts, as I didn’t know what I was doing and was massively undercapitalised. Suffice to say it put me off using a leveraged account and I decided to educate myself and invested in actual stocks and shares in an ISA instead. But now I’m more confident in my trading ability and am very strict with my money management, I thought I could handle a spread betting account better now.
The performance in the account over the first two and half months has been reasonable. October was +1.02%, November was +2.46% and in December I hit my draw down limit of 1.5% in the middle of the month, so I stopped trading and did some analysis of my trades and lots of reading. Which I’m really pleased I did now, as it’s been really helpful to spend time analysing my trades in depth and see where I’m making the biggest mistakes.
I’d say I’m mostly a swing trader, but my recent reading has led me to look into breakouts using stocks that are strong relative to their sector and the market. So instead of buy low and sell high, the aim will be to buy high and sell higher. I think both methods have their strengths, so I will use my discretion and not stick slavishly to one method.
I tend to be a long only trader, but if I see an opportunity to go short then I will if the price action and setup looks right. But I’ve been more successful on the long side.
Money mangement
Maximum risk per month: 1.5%
Target risk per trade: 0.5%
Because of the account size I’m limited in what I can trade which meet my risk tolerances, so a lot of stocks, commodities and indices won’t be accessible to me until I have a bigger account. Especially as I plan to scale into my positions, so as to limit the risk of a wrong decision affecting my account in a big way. In Reminiscences of a Stock Operator the person talked of scaling into a position in five trades and only scaling in when each position was making profit. I’d like to do that, but it would limit what I could trade even more, so I’ll try and aim for 2 to 3 steps.
Trade Rules
Every potential trade needs to be put into my trading spreadsheet before I place an order. Every column needs to be filled in, especially the stop loss, target and risk/reward ratio.
1. Calculate the stop loss position. I use trailing stops with the Elder safezone method.
2. What’s the Daily Channel size? – I use Keltner Channels with a 22 day exponential moving average and a 10 day Average True Range (ATR) with a multiplier of 2.7. This is used to calculate price targets and grade the trades once they are closed.
3. Calculate the exit price target. This is normally the top of the channel if bought in the middle of the channel or the value zone between the 11 Day EMA and 22 Day EMA if a swing trade. But the aim is to get 30% or more of the daily channel size on each trade.
4. Calculate the entry price target.
5. Do I have available risk based on the 1.5% rule?
– If no, then no trade is possible. Place on my watchlist.
– If yes, then calculate the risk reward ratio.
– Is the ratio 2 or above?
– If no, then no trade is possible
– If yes, calculate how much I should risk for the initial postion.
6. Create a diary entry.
7. Once the trade is completed, update the trading spreadsheet and update the diary with the exit charts.
8. Analyse the closed trades at the weekend to see how I can improve.
Trade Grades
Each trade is graded once it is closed by using the percentage of the daily channel captured from when the trade was opened. A to C- grades are profitable trades and D grades and below are a loss.
A+ 40% and above
A 30-40%
B 20-30%
C 10-20%
C- 0-10%
D Below 0%
E Below -10%
F Below -20%
G Below -30%
Weekly
– Update the equity curves
– Update the trading spreadsheet and monitor risk
– Review the weekly and daily charts of the indexes, commodities and major currencies.
– Check the economic data scheduled for the week ahead.
End of Month
– Update the monthly performance chart
– Recalculate the maximum risk for the following month
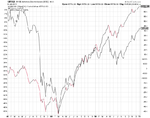
– Calculate relative performance versus the S&P 500 index
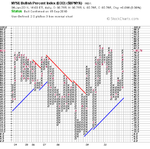
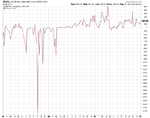
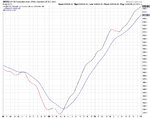
– Review the market breadth charts (New Highs New Lows, NYSE Bullish Percent Index and NYSE Cumulative Advance Decline)
– Review the monthly charts of the indexes, commodities and major currencies.
Conclusion
I think this quote from Jesse Livermore is suitable as a conclusion to my trading plan. "A trader, in addition to studying basic conditions, remembering market precedents and keeping in mind the psychology of the outside public as well as the limitations of his brokers, must also know himself and provide against his own weaknesses."
Below is my trading spreadsheet, monthly performance chart, profit and loss chart and ratio vs the S&P 500 so far.
Attachments
Last edited:


