isa's short term trading journal

isatrader

Senior member
Messages
2,963
Likes
135
I’m starting this new thread for my active trading via my spread betting account. I will be focusing on trading the S&P 500 index, Stocks and Commodities. My goal is make 3%+ per month but risk a maximum of only 1.5% of the account a month to achieve this.

I’m a discretionary trader, so I don’t have a set mechanical system to follow, but I’ve been trading fairly actively in an ISA for the last few years and have got to a reasonable level of proficiency (see my other journal Trading in an ISA to pay off my mortgage). So I’m confident that I can continue to be profitable, and hopefully more profitable than before by trading actively with much lower costs than I’ve been able to in an ISA.

I began the spread betting account in the middle of October 2010 with £4024.61. The £24.61 was left over from 2007 when I first tried spread betting and managed to blow up a few small £500 accounts, as I didn’t know what I was doing and was massively undercapitalised. Suffice to say it put me off using a leveraged account and I decided to educate myself and invested in actual stocks and shares in an ISA instead. But now I’m more confident in my trading ability and am very strict with my money management, I thought I could handle a spread betting account better now.

The performance in the account over the first two and half months has been reasonable. October was +1.02%, November was +2.46% and in December I hit my draw down limit of 1.5% in the middle of the month, so I stopped trading and did some analysis of my trades and lots of reading. Which I’m really pleased I did now, as it’s been really helpful to spend time analysing my trades in depth and see where I’m making the biggest mistakes.

I’d say I’m mostly a swing trader, but my recent reading has led me to look into breakouts using stocks that are strong relative to their sector and the market. So instead of buy low and sell high, the aim will be to buy high and sell higher. I think both methods have their strengths, so I will use my discretion and not stick slavishly to one method.

I tend to be a long only trader, but if I see an opportunity to go short then I will if the price action and setup looks right. But I’ve been more successful on the long side.

Money mangement

Maximum risk per month: 1.5%
Target risk per trade: 0.5%

Because of the account size I’m limited in what I can trade which meet my risk tolerances, so a lot of stocks, commodities and indices won’t be accessible to me until I have a bigger account. Especially as I plan to scale into my positions, so as to limit the risk of a wrong decision affecting my account in a big way. In Reminiscences of a Stock Operator the person talked of scaling into a position in five trades and only scaling in when each position was making profit. I’d like to do that, but it would limit what I could trade even more, so I’ll try and aim for 2 to 3 steps.

Trade Rules

Every potential trade needs to be put into my trading spreadsheet before I place an order. Every column needs to be filled in, especially the stop loss, target and risk/reward ratio.

1. Calculate the stop loss position. I use trailing stops with the Elder safezone method.

2. What’s the Daily Channel size? – I use Keltner Channels with a 22 day exponential moving average and a 10 day Average True Range (ATR) with a multiplier of 2.7. This is used to calculate price targets and grade the trades once they are closed.

3. Calculate the exit price target. This is normally the top of the channel if bought in the middle of the channel or the value zone between the 11 Day EMA and 22 Day EMA if a swing trade. But the aim is to get 30% or more of the daily channel size on each trade.

4. Calculate the entry price target.

5. Do I have available risk based on the 1.5% rule?
– If no, then no trade is possible. Place on my watchlist.
– If yes, then calculate the risk reward ratio.
– Is the ratio 2 or above?
– If no, then no trade is possible
– If yes, calculate how much I should risk for the initial postion.

6. Create a diary entry.

7. Once the trade is completed, update the trading spreadsheet and update the diary with the exit charts.

8. Analyse the closed trades at the weekend to see how I can improve.

Trade Grades

Each trade is graded once it is closed by using the percentage of the daily channel captured from when the trade was opened. A to C- grades are profitable trades and D grades and below are a loss.

A+ 40% and above
A 30-40%
B 20-30%
C 10-20%
C- 0-10%
D Below 0%
E Below -10%
F Below -20%
G Below -30%

Weekly

– Update the equity curves
– Update the trading spreadsheet and monitor risk
– Review the weekly and daily charts of the indexes, commodities and major currencies.
– Check the economic data scheduled for the week ahead.

End of Month

– Update the monthly performance chart
– Recalculate the maximum risk for the following month
– Calculate relative performance versus the S&P 500 index
– Review the market breadth charts (New Highs New Lows, NYSE Bullish Percent Index and NYSE Cumulative Advance Decline)
– Review the monthly charts of the indexes, commodities and major currencies.

Conclusion

I think this quote from Jesse Livermore is suitable as a conclusion to my trading plan. "A trader, in addition to studying basic conditions, remembering market precedents and keeping in mind the psychology of the outside public as well as the limitations of his brokers, must also know himself and provide against his own weaknesses."

Below is my trading spreadsheet, monthly performance chart, profit and loss chart and ratio vs the S&P 500 so far.
 

Attachments

  • Trades_spreadsheet_3-1-11.png
    Trades_spreadsheet_3-1-11.png
    19.9 KB · Views: 11,337
  • Monthly-Perf_3-1-11.png
    Monthly-Perf_3-1-11.png
    5.9 KB · Views: 602
  • Equity-Curve_3-1-11.png
    Equity-Curve_3-1-11.png
    7.1 KB · Views: 650
  • Ratio-vs-SP500_3-1-11.png
    Ratio-vs-SP500_3-1-11.png
    8.6 KB · Views: 688
Last edited:
SP 500 Short Entry – Mar 11 Spread

I’ve gone Short the SP 500 Mar 11 Spread

Entry Price: 1264.80
Stop: 1273.20
Target: 1225.00

Risk/Reward Ratio: 4.74
 

Attachments

  • SP500_30min_4-1-10_entry.png
    SP500_30min_4-1-10_entry.png
    27 KB · Views: 707
Re: SP 500 Short Entry – Mar 11 Spread

I’ve gone Short the SP 500 Mar 11 Spread

Entry Price: 1264.80
Stop: 1273.20
Target: 1225.00

Risk/Reward Ratio: 4.74

I had a power cut at midday today and the sky broadband modem broke. So I’ve had no internet all day. Is really annoying as it is going to take them 5 days to send a replacement box. Finally realised I could still use dial up about 30 mins ago, but only if you turn off all the JavaScript and images. Otherwise it takes an age for a page to load. Anyway, because of all this bother today, I wasn’t able to get onto my spread betting platform to close my position out when the down move started to turn around in the S&P. So annoyingly it’s been closed out at my stop loss.
 
Market Breadth Charts

Attached is the the following Market Breadth Charts from stockcharts.com free charts section:

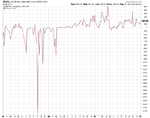
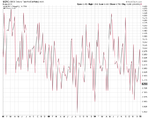
$CPC (CBOE Options Total Put/Call Ratio)
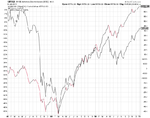
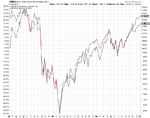
$NYAD (NYSE Advance Decline Issues (EOC)) – I’ve put the S&P 500 behind to compare.
$NYSI (NYSE McClellan Chart)
$NYHL (NYSE New Highs-New Lows (EOD))
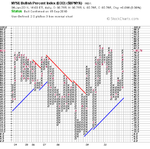
$BPNYA (NYSE Bullish Percent Index)
$NYA200R (NYSE Percent of stocks above the 200 day moving average)

Also I’ve included the following relative performance charts

$NYA:$USD (NYSE/US Dollar)
$NYA:$SPX (NYSE/S&P 500)
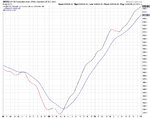
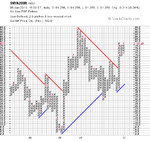
$INDU ($TRAN behind price – Dow Theory)
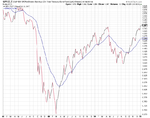
SPY:TLT (S&P 500 SPDRs/iShares Barclays 20+ Year Treasury Bond Fund – This is a measure of the risk on, risk off trade. It looks like it needs a pullback to the moving average soon.)
 

Attachments

  • SharpChartv05.png
    SharpChartv05.png
    32.9 KB · Views: 522
  • sc-3.png
    sc-3.png
    23.2 KB · Views: 519
  • sc-2.png
    sc-2.png
    20.7 KB · Views: 530
  • sc-1.png
    sc-1.png
    31.4 KB · Views: 511
  • sc.png
    sc.png
    45.2 KB · Views: 569
  • SharpChartv05-1.png
    SharpChartv05-1.png
    27.8 KB · Views: 564
  • sc-8.png
    sc-8.png
    31.8 KB · Views: 513
  • sc-7.png
    sc-7.png
    34 KB · Views: 533
  • sc-5.png
    sc-5.png
    28.7 KB · Views: 476
  • sc-4.png
    sc-4.png
    23.7 KB · Views: 459
SP 500 Short Entry – Mar 11 Spread

I’ve gone short the SP 500 Mar 11 Spread again after the earlier failed attempt this week. My broadband is fixed and I have a backup USB mobile broadband as well now, so no excuses for missing the move this time.

Non Farm Payrolls created some volatility today, but I waited until the US session had had a chance to digest it a bit and see what direction seems to be forming at the moment.

Trade
SP 500 Mar 11 Spread
Entry Price: 1267.1

Stop: 1278.4
Target: 1244.5

Account Risk: 0.14%
Potential Account Profit: 0.28%
Risk Ratio: 2

Update (5pm): The entry point seems to be ok, prices have broken down towards the main uptrend line which should provide some support, so a new short term down trend line is in place with the meeting of the lines on Tuesday next week.
 

Attachments

  • SP500_4hr_7-1-10_entry.png
    SP500_4hr_7-1-10_entry.png
    30.8 KB · Views: 563
  • SP500_Daily_7-1-10_entry.png
    SP500_Daily_7-1-10_entry.png
    24.6 KB · Views: 449
Last edited:
Weekend Update

I’ve had a fairly slow start to the new year and only entered two trades. The first one was correct on the intraday move, but I wasn’t able to monitor the position due to broadband problems, so it closed out at the initial stop loss I set when the price rebounded. I put on the second trade yesterday a few hours after the US opened to give it time to absorb the NFP data earlier in the day. I used a very small position size of 0.14% as it was a short entry and the market has struggled to breakdown of late. But my intention is to add to the position if the market looks to be going that way next week. But if it doesn’t then the loss to the account will be limited to a maximum of 0.14%.

I’m in a protective mode at the moment as the market is up over 20% since the summer lows. So using Victor Sperandeo’s advice from The New Market Wizards book, that would put the current bull move in 80 year old+ category. So although it might live on for a while yet, the probability of a reversal is getting more likely every day. So I’m going to keep position sizes small and trade without directional bias. i.e. both short and long positions and see how I go.

Attached below is my trades spreadsheet and profit and loss chart.
 

Attachments

  • Trades_spreadsheet_7-1-11.png
    Trades_spreadsheet_7-1-11.png
    29.1 KB · Views: 12,995
  • Equity-Curve_7-1-11.png
    Equity-Curve_7-1-11.png
    7.4 KB · Views: 513
Re: SP 500 Short Entry – Mar 11 Spread

I’ve gone short the SP 500 Mar 11 Spread again after the earlier failed attempt this week. My broadband is fixed and I have a backup USB mobile broadband as well now, so no excuses for missing the move this time.

Non Farm Payrolls created some volatility today, but I waited until the US session had had a chance to digest it a bit and see what direction seems to be forming at the moment.

Trade
SP 500 Mar 11 Spread
Entry Price: 1267.1

Stop: 1278.4
Target: 1244.5

Account Risk: 0.14%
Potential Account Profit: 0.28%
Risk Ratio: 2

Update (5pm): The entry point seems to be ok, prices have broken down towards the main uptrend line which should provide some support, so a new short term down trend line is in place with the meeting of the lines on Tuesday next week.

Trade Update

Price in the S&P broke down to test yesterdays lows today during the European session, but have rebounded back up to my entry level of 1267.1. I’ve been moving my trailing stop down and the account risk is now only 0.04%.

Technically there’s a triangle formation on the chart which converges on Tuesday night, so a possibility of a tight range tomorrow between the trend lines. It hasn’t reached the downtrend line on the RSI yet and MACD is ticking up as well, so the key for me will be how it reacts to the downtrend line if it reaches it. As I’m planning to add to my position if it makes a convincing top there.

Below is the updated 4 hr chart.
 

Attachments

  • Picture 4.png
    Picture 4.png
    75.3 KB · Views: 583
SP 500 Short Exit – Mar 11 Spread

Trade Update

Price in the S&P broke down to test yesterdays lows today during the European session, but have rebounded back up to my entry level of 1267.1. I’ve been moving my trailing stop down and the account risk is now only 0.04%.

Technically there’s a triangle formation on the chart which converges on Tuesday night, so a possibility of a tight range tomorrow between the trend lines. It hasn’t reached the downtrend line on the RSI yet and MACD is ticking up as well, so the key for me will be how it reacts to the downtrend line if it reaches it. As I’m planning to add to my position if it makes a convincing top there.

Below is the updated 4 hr chart.

My short position in the SP 500 Mar 11 Spread was stopped out at 1272.5 after the market broke through the short term down trend line earlier today and has continued higher throughout the session. I had raised my trailing stop a few points this morning before going to work - to give it a little bit more room, but the move higher proved too strong. The technicals still look like the market is near a top, but the price action is to the upside still, so although I have a short bias, I’m going to wait for the price action to give a new signal before getting back in again for a third try at shorting the market.

Closing trade
Entry Price: 1267.1
Exit Price: 1272.5
Points: -5.4
Trade Percentage: -0.42%

Daily Channel Captured: -13%
Trade Grade: E

Account P/L: -0.07%

Below is the 2hr chart of the whole trade.
 

Attachments

  • SP500_2hr_7-1-10_exit.png
    SP500_2hr_7-1-10_exit.png
    32.3 KB · Views: 505
Hecla Mining (HL) – Entry

Trade
Hecla Mining Mar 11 Spread

Entry Price: 1036.5

Stop: 968
Target: 1161.5

Account Risk: 0.55%
Potential Account Profit: 1.01%
Risk Ratio: 1.82

Hecla Mining (HL) is a silver miner and has a big run of late. Looks like it’s pivoting to me and following the gold and silver move. My entry wasn’t as good as I wanted as I just missed my target price, so the risk is 0.05% higher than my maximum for a single trade of 0.50%

Attached is the 30 minute entry chart and the daily gold chart.
 

Attachments

  • HL_30min_11-1-11_entry.png
    HL_30min_11-1-11_entry.png
    29.3 KB · Views: 335
  • Gold-Daily-11-1-11.png
    Gold-Daily-11-1-11.png
    32.9 KB · Views: 342
Sharp Ratio Target

Attached is the sharp ratio calculation for my spread betting portfolio. The annual calculation is my target which is based on my target profit of 3% a month and the current calculation for the first 3 months trading is at the bottom.

Annual Sharp Ratio Target: 6.09

Current 3 month Sharp Ratio: 0.52
 

Attachments

  • Sharp-Ratio-11-1-11.png
    Sharp-Ratio-11-1-11.png
    17.1 KB · Views: 389
Aren't you wasting your time with target of 3% per month?
No offence.

If you are " an active s/b trader" your target should be around 2-3% a week.
 
Aren't you wasting your time with target of 3% per month?
No offence.

If you are " an active s/b trader" your target should be around 2-3% a week.

None taken, I’m not a day trader - I have a full time job. So unless I was considering myself in the same category as the market wizards I think a 36% target for the year would be excellent by only risking 1.5% a month. I will be really happy if I manage to make 10% by the year end.
 
If you are " an active s/b trader" your target should be around 2-3% a week.

I thought it would be good to clarify why the title is active spread betting journal. I appreciate the majority of people on this site are day traders and trade mostly forex, so they probably won’t agree that I’m actively trading, so maybe I should have used a different title like 'Whenever I see a trade spread betting journal. But you can’t change it, so that’s what I’m stuck with.

I’m not a day trader, I run a graphic design service from home and monitor the market throughout the day. So although I do place intraday trades some of the time. Most of my trades will be a few days or more with the spread betting account and sometimes even longer as I like to use a trailing stop.

My main shares account is in an ISA, and I’ve been told I was trading too actively in it, which was costing me too much money per trade and affecting my profit margin. So I’ve moved my active trading to this spread betting account with lower fees, and am keeping my longer term portfolio in the ISA.

Hope that helps to clarify the rubbish title.
 
Money Management

Money mangement

Maximum risk per month: 1.5%
Target risk per trade: 0.5%

Because of the account size I’m limited in what I can trade which meet my risk tolerances, so a lot of stocks, commodities and indices won’t be accessible to me until I have a bigger account. Especially as I plan to scale into my positions, so as to limit the risk of a wrong decision affecting my account in a big way. In Reminiscences of a Stock Operator the person talked of scaling into a position in five trades and only scaling in when each position was making profit. I’d like to do that, but it would limit what I could trade even more, so I’ll try and aim for 2 to 3 steps.

I thought I’d add to my money management section from the opening post as just saying Maximum risk per month: 1.5% and Target risk per trade: 0.5% isn't very clear as it doesn’t mean I'm only risking 1.5% of my account size each month, as the trade sizes would have to be minuscule.

Every trade is placed including a stop loss, which in theory limits the risk to the stop loss level, which I aim to set to a maximum of 0.5% risk per trade. Of course though, the market or share could gap past the stop loss and be closed at a much lower price. So to mitigate against a catastrophic loss (black swan event) my aim is to only trade long in shares and indexes that I could afford to lose 100% in without it blowing up my account. For example if I trade the SP 500 Mar 11 Spread for 50p per point and the price is 1270. The maximum risk to my account is £635 if it crashed to zero. Which is around 15% of my account. However if I go short the risk is much higher on individual shares as a bid or some other news could send it through the roof. So my aim is to only go short on the SP 500 spread as the probability of that going up 100% or more instantly is very low, but could still happen someday. A Flash spike caused by the trading machines maybe or something no one’s thought of yet.

Another account protection I have is that I will generally only have a few or more trades on at the same time and I usually won’t put on the second trade until the first trades stop loss has moved to break even. So if my total black swan risk gets above 50% then I won’t add anymore positions.
 
SP 500 Long Entry – Mar 11 Spread

Trade
SP 500 Mar 11 Spread

Entry Price: 1282.9

Stop: 1279.9
Target: 1292.9

Account Risk: 0.04%
Potential Account Profit: 0.60%
Risk Ratio: 16.29
 
Indecisive Market Direction

I did a bit of day trading on the SP 500 Mar 11 Spread today. But the market whipped around in a tight range with five major direction changes. My stops were much tighter because it was a day trade, and my stops were clearly in congested areas which were sought out by the market which then preceded to make a reversal each time. My other open position in Hecla Mining was hit hard by the drop in gold and silver. My stop was in a obvious position and as the market was clearly seeking out stops and the indicators were showing it as a possible double bottom, I decided to give it some more room. It turned out to be the right call for the moment as the price moved a few points below the previous low (which would have stopped me out) and reversed. I would have been stopped out at the low of the day if I hadn’t have moved it. So I’m hoping for a reversal tomorrow as it hasn’t been a good week so far.

Todays trades
1. US SP 500 Mar 11 Spread -3 pts
2. US SP 500 Mar 11 Spread -3.8 pts

Total: -6.8 pts
 
SP 500 Short Entry – Mar 11 Spread

Trade
Short – SP 500 Mar 11 Spread

Entry Price: 1281.8

Stop: 1291.6
Target: 1262.5

Account Risk: 0.12%
Potential Account Profit: 0.24%
Risk Ratio: 2
 

Attachments

  • SP500_30min_13-1-10_entry.png
    SP500_30min_13-1-10_entry.png
    27.5 KB · Views: 225
  • SP500_4hr_13-1-10_entry.png
    SP500_4hr_13-1-10_entry.png
    30.8 KB · Views: 219
Re: SP 500 Short Entry – Mar 11 Spread

Interesting thread (including the one it was continued from). I'm always interested in seeing people apparently doing ok with spread-betting, considering how many people are ready to say SB is rubbish. I haven't looked yet, but I will take a look at your ISA log, as I'm interested to see how people use these for stocks. I have a fund-based ISA, and I've always thought I should be able to do at least as well as the funds I'm in, and save the fees they charge).

Have you given up on Forex for the time being?
It's certainly not as easy as some people seem to claim (especially the vendors wanting such suck you in), but it's not impossible, either. Others might argue that it's possible, but not within a SB framework. I think it is, but you do have to be very careful, not least in your choice of SB shop.


Good luck!

I’ve not had a big problem with spread betting yet, but like you I have read the bad stories about it. So I am on my guard against anything underhand. The firm I use seems ok though and I try to trade things that have high liquidity like the S&P 500 and US stocks and stocks in the FTSE. One thing I did notice they did though, was when the rally was picking up steam a few months back they took off a lot of the stocks from their system so that people couldn’t find them to trade them. So I’ve now added my favourite stocks to a watchlist so I don’t have to search for them, and will see if they disappear the next time there’s a big bull run.

With regards to forex. I’ve taken a pause for the moment as the position sizes are too big for my account as it stands. I estimate I’d need around three times the size account to trade forex using my risk management methods, and also I like to focus my trading, so spreading myself across indicies, stocks, commodities and forex as well seemed liked I was spreading myself too thin. As each area requires different methods and analysis. So my focus for the spread betting account for the moment is short term moves in the S&P 500 and commodity related stocks, as my trading experience from my longer term investing is in precious metals and commodities.
 
Top