isa's long term trading journal

isatrader

Senior member
Messages
2,963
Likes
135
Welcome to my ISA trading diary.

The purpose of this journal is help me evaluate my trades in more depth, both before I place them and after I close them.

As you’ll see from the title. I’m using the tax free ISA wrapper and currently trading a small £8k account with the aim of growing it steadily through trading and topping up the the ISA each year with as much cash as possible (max currently £10,200 a year). So I can pay off my mortgage early and have a tax free pension.

I started trading in early 2007 and traded wildly like most new traders do, with no particular plan or goal. I just wanted to make some good money on top of my regular income from working as a designer. I placed some small trades in stocks I read about and soon learnt that bid/offer spreads and broker commissions make it impossible to make any decent returns unless you trade a decent amount of shares.

I then got into spreadbetting and started to learn about technical analysis and did quite well for a while day trading various things until I got wiped out by a single trade in GBPUSD. It stung, but I learned a valuable lesson about money management and not trading a product that was too big for my account size. After a few more bad losses I thought it was a good point to stop for a while and get some education.

So I read a lot of books on trading; started having the financial channels on all day while I was working and paper traded a bit. My favourite book is "Come Into My Trading Room" By Alexander Elder. That was the one that really helped me the most and I use a lot of his techniques for my trading today, although I’ve adapted some of his techniques from others things I’ve read like the rRelativite method from Zeal, of using the 200 day simple moving average as a baseline to help identify extremes in price and potential areas of support and resistance and created my own indicator from it.

After reading another book "The Naked Trader", where he talked about trading for his pension, I realised that I could use my yearly ISA allowance to trade in tax free. So my grand plan was born, to pay off my mortgage and create a tax free pension in my ISA by trading and adding as much cash as possible to my ISA each year so I could gradually trade larger amounts as it grew.

So at the end of September 2008 I started trading in my ISA as a serious amateur, which as most of you will know who were trading then, was a crazy time in the markets, with the credit crisis hammering the markets daily. I took some big early losses and my first 3 trades all lost big. But I got out of them quickly and fortunately my preference of trading metals like silver and nickel meant I managed to recover strongly by the end of the year.

From then to now has been a huge learning curve. You’ll see from my equity curve (which I will attach) that I had big ups and downs in the first year of trading. Which was mainly due to my mistake of trading leveraged ETFs. I’ve since learnt that these can be very hazardous if you don’t understand how they work properly as the majority underperform the index they are tracking dramatically. Especially the energy ETFs which suffer from contango from contract rollovers in the futures markets.

I’m still suffering to this day with the leveraged natural gas shares I bought and didn’t take my losses on as I should have a long time ago. I even bought some more recently to average down the position (DON’T do this!) as it had got so bad. Which I shouldn’t have done and plan to never do again.

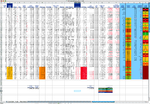
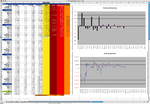
Anyway, enough of the self pity. I imagine if you’ve read this far you want to see how I trade, so you can mock my rubbishness and hopefully learn from my mistakes. So below is my trades laid bare with every trade since I started doing this two years ago. The open trades are coloured gold at the bottom of the list and if you ignore the bunch of losing heavily leveraged natural gas trades (LNGA) from 2009, that are still open and make up a rather large £778.72. Then I’m currently only down a bit on some fairly recent trades where I rebalanced my portfolio to have a bit more risk. Incidentally, these were all positive two days ago before China announced a 25 basis point rate hike which spooked the markets yesterday, but I’m feeling confident that the fourth quarter will be strong and positive for the stock market and metals in general.

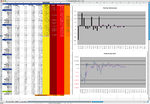
So attached is my all my trades that I have done in the last 2 years and my equity curve so far. Which has been fairly flat all year with no losses in a single month much below 3% so am pleased with that as am getting my money management under control. You’ll notice that all the costs of trading are included and it’s an eye opener for any newbies, as I’ve given over more than £1K in fees and commissions which has dampened my profits somewhat.

Anyway I hope you enjoy my journal and I will aim to update it on a regular basis with my entries and exits and my trading spreadsheet.
 

Attachments

  • ISA_Spreadsheet_20-10-10.png
    ISA_Spreadsheet_20-10-10.png
    77.7 KB · Views: 4,158
  • Equity-Curve_20-10-10.png
    Equity-Curve_20-10-10.png
    60 KB · Views: 2,391
Last edited:
Attached is a screenshot of my most recent trade in Vedanta (VED).

Entry Date: 11/10/10
45 Shares
Entry Price: £22.14
Entry Commission: £12.50
Stamp Duty: £4.98
Total: £1013.78

Breakeven: £22.79
Target: £29.50
Stoploss: £19.71

Entry Grade: 46%
rValue Zone: Just above the daily value zone
Risk/Reward Ratio: 2.16

The reason I went long in Vedanta is that I think they are a well run company with a strong balance sheet. Their recent statements were positive on their outlook for the coming year and I wanted a play on industrial metals with good emerging market exposure in my portfolio. I scanned the charts of the major miners in the FTSE and Vedantas chart looked like it had the most potential after a good year of consolidation after the big run up last year in the stock.
The technicals looked promising on the weekly and daily charts, and I think the major indices are breaking out of their summer ranges to the upside which should give the miners a boost as they tend to be a leading sector when risk is on at the moment I think.
Anyway hopefully it will be a good buy for my portfolio, but I will be watching for a big pullback if it reaches the downtrend resistance at £25 as looks like it has fairly big sell offs when it does.

thanks for reading

isatrader
 

Attachments

  • Vedanta_20-10-10.png
    Vedanta_20-10-10.png
    142.5 KB · Views: 711
I thought it would be good to show a recently closed trade which although on chart looks very successful. In reality it highlights the problems of trading a smallish size (£1000) and also the issue of trading commodities ETFs which are priced in dollars.

Over the last few years I’ve had many successful trades in gold and silver, but when the dollar is moving so strongly against the pound it is very hard to make a profit.

Here’s the trade in dollars

Entry Date: 14/9/10
Amount: 12 Shares
Entry Price: $124.32 @ fx rate 1.5420
Commission: $19.275
Total: $1511.12

Exit Date: 8/10/10
Amount: 12 Shares
Exit Price: $131.6352 @ fx rate 1.5838
Commission: $19.7975
Total: $1579.62

So that’s a reasonable 4.5% gain in dollars.

Here’s the trade in pounds

Entry Date: 14/9/10
Amount: 12 Shares
Entry Price: £80.62185
Commission: £12.50
Total: £979.96

Exit Date: 8/10/10
Amount: 12 Shares
Exit Price: £83.1145
Commission: £12.50
Total: £984.87

So that’s a very measly 0.05% gain in pounds. Not very inspiring eh!

This has led me to reevaluate my portfolio recently, as I was heavily weighted in dollar denominated ETFs. Which was keeping me flat profit wise while a huge rally was occurring in metals. So my reason for closing this trade was solely down to the fact that I wanted to move into pound based stocks so I could participate in the bull run in metals properly.

The charts are below

isatrader
 

Attachments

  • PHAU_8-10-10.png
    PHAU_8-10-10.png
    127.2 KB · Views: 561
Something else I learned early on with ISA accounts is that there is no cheap brokers. The cheaper options tended to give me prices way above market price and one even charged a 1.5% extra fee for currency conversion when I traded PHAU earlier in the year on top of spread and commission. It then took them 3 months to transfer me to another broker which charges £12.50 per trade. Which seems steep, but their prices are accurate with market bid/ask prices and they don’t charge extra for ETFs priced in dollars, which was terrible I thought.
Changing between ISA takes months to achieve. Which leaves you high and dry during that time. I’ve changed 4 times and the quickest was about a month. So I’d recommend not going with the cheapest options as they make it up and then some in other hidden fees and slippage.

It really amazes me how brokers can get away with taking so long to complete the transfer and I really believe there needs to be legislation put in place to sort out the issue. I was even charged a £58.75 admin charge for the privilege to leave them. Now, that’s just not right.

Anyway enough of a rant, thanks for reading my journal.

isatrader
 
I’m working on a new theory this morning, as I had a good idea when I was going to sleep last night about my entry points when I buy stocks.

Basically I’ve noticed that even my best trades can be down for a while before going positive, which means sitting watching them for weeks doing nothing much before they finally make a profit or I end up closing for a loss.

My idea is to set myself up a live paper trading account to use as a watchlist for my watchlist stocks that are in a weekly uptrend and paper buy them at their most recent high in the uptrend. So the theory is that any that pullback by around 10% and pass all my normal methods for entering a position are then possible trades. As they will have already lost 10% from their recent high and I tend sell positions once they have lost 10% or more. This will hopefully give me a buffer for my trades, as any that tumble another 10% would most likely be making a reversal as would have lost 20% in total from their recent high.

I’ll let you know how I get on with it

isatrader :)
 
Markets were quite choppy today. I generally tend to ignore the day to day noise unless there is a big move. So I wasn’t too fussed by today's action, but there has been an increase in market volatility the last few days, so I’m considering putting a spreadbet on the VIX to add some protection to my portfolio, as it’s currently near it’s April low of this year. So my thought process is that it has limited downside (risk/reward looks around 4 to 1 in favour of reward), but some good upside potential if the markets get spooked and sell off.

It spiked into the mid 40s back in May and I’m thinking the Fed announcement on Nov 3rd on QE2 could possibly disappoint the market as people are expecting too much and have already bid the market up on the speculation. So if that theory turns out to be correct I think the VIX protection should make up for loses in my portfolio from a sell off.

However, I’m still learning and might be completely wrong, so don’t take my word for it.

Below is the $VIX chart from stockcharts.com

isatrader :)
 

Attachments

  • $VIX_21-10-10.png
    $VIX_21-10-10.png
    21.6 KB · Views: 949
I thought it would be good to review some of my open trades today because of the market choppiness. So below is the chart on Fresnillo (FRES).

I bought this stock last week on the 11/10/10 after closing my trade in the Silver ETF (PHAG), because it was priced in dollars and I wanted to move away from having too many stocks priced in dollars in my account. I think the pound is in a weekly uptrend currently and the FED seems intent on winning the currency battles of devaluation, so I thought I’d add some protection to my account by moving some of my holdings into pound based stocks.

My analysis of it from what I interpret on the charts, is that it’s consolidating and making a bull flag. But this is currently being tested, as it is right on a fairly major trend line and a weekly close below that might see it drop back towards the next trendline, which looks to be around the 1100 level. I’ve traded silver quite a few times over the last few years and it can be very volatile, so I’ve got a wide stop on this. But my intermediate term hope is that it should retest the latest high even if it drops off a bit for a while.
On the weekly chart it’s crossed into my buy zone on my rRelative indicator, Elder Impulse system is Flat and it hasn’t crossed the Elder Safezone Stop so am still confident here.

Daily indicators are a bit worse looking, but the Force Index indicator hasn’t crossed below it’s 22 day moving average line so not a sell signal for me yet.

Again this is all just my opinion and I could be wrong, so make up your own mind if trading it at all.

isatrader
 

Attachments

  • Fresnillo_21-10-10.png
    Fresnillo_21-10-10.png
    138.4 KB · Views: 548
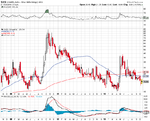
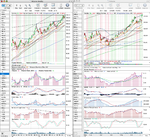
The market is testing my resolve this morning. With my portfolio dropping back to my break-even point for the first time this year. So I thought I’d have a look back at a historical S&P 500 chart that I created a while ago – which averages all the data from the S&P 500 since 1950, to see where we are in the grand scheme of things.

According to the chart the 208th day is the low point of this quarter which is around the last few days of October. So if that holds true I could see a further dip in my stocks before the month ends. However, the November-December period looks very strong with an average 4% rally in the S&P 500 over the last 60 years. So if that comes to pass then with any luck I should grind out some modest gains before the year end. I just need to hold my nerve and try to ignore the noise.

Below is the historical S&P 500 chart I made and I’ve also included the same chart but with only the Bear years in it for comparison.

isatrader
 

Attachments

  • SP500-Historical_22-10-10.png
    SP500-Historical_22-10-10.png
    25.4 KB · Views: 475
  • SP500-BearHistorical_22-10-10.png
    SP500-BearHistorical_22-10-10.png
    26.6 KB · Views: 438
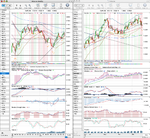
Weekly Market Charts Overview

GBP/USD
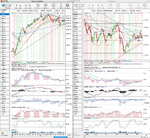
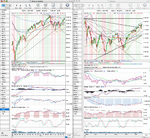
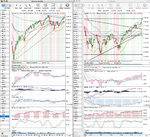
A strong down week for GBP/USD on increasing volume after stalling at the 1.60 resistance point.
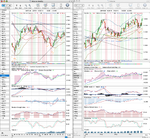
Daily indicators have turned negative with a cross below the Chandelier Exit stop loss on the 19/10/10 and a force index cross, which for me confirms the exit. MACD and RSI are both in daily down trends and the rRelative indicator has broke below it’s 52 day EMA.
Weekly indicators are all at critical points, with a slight close below the price trendline that’s been in place since May. Other indicators have turned down and the rRelative indicator is in the value zone. Weekly safezone stops haven’t been breached yet and the price is sitting right on the 2 year 61.8% Fibonacci line.
So my thoughts are that the short term downside move could continue this week, but there should be strong support in the 1.53 area to the downside. If it turns around though, the 1.60 area should be strong resistance to the upside.

S&P 500
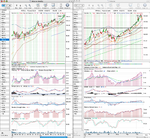
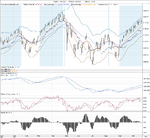
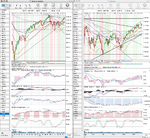
A choppy week in the S&P, but ending slightly higher than last weeks close. So still positive on the price action.
Weekly indictors are broadly positive and the trend looks in tack for now.
Daily indicators are mostly positive, but the RSI has a slight divergence, and the MACD has a large negative divergence to price. So the warning signals are flashing. The buy signal is still on, but it might be time to tighten up my stoplosses.

Gold
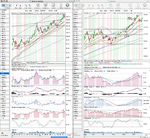
A bad week for gold. Weekly Safezone stop has been breached and price has pulled back to the value zone on the rRelative indicator. Other indicators have also pulled back to their moving averages. So the Elder impulse indicator has turned to Flat.
Daily indicators have been hit hard and have fallen sharply. But aren’t looking negative yet still, as the market was very short term overbought so a healthy correction was needed I think. Price has pulled back to the long term rising trend line and has paused there. Force index hasn’t broken it’s 22 day moving average yet, but is very close. RSI, Stochastics and MACD are all negative and Elder Impulse is on a downtrend signal. The buy signal also turned off when the Chandelier Exit stop loss was breached on the 19/10/10.
My thoughts on gold are still positive. I think some consolidation is needed before it advances further though, and could sell off more short term as the speculators in the market get spooked and take profits. But I still have a year end profit target of between 1400 and 1500 as rRelative is only 12% above the 200 day moving average and previous recent tops have taken it to 22% and 31% above the 200 day moving average. So still a possible 20% in this move hopefully.

As always, this is all just my opinion from what I see and I’m just an amateur, so don’t base any of your decisions on any of this, as the market might disagree with me.

isatrader
 

Attachments

  • GBPUSD_Signals_22-10-10.png
    GBPUSD_Signals_22-10-10.png
    61 KB · Views: 725
  • GBPUSD_22-10-10.png
    GBPUSD_22-10-10.png
    133.6 KB · Views: 666
  • SP500_22-10-10.png
    SP500_22-10-10.png
    146.7 KB · Views: 503
  • SP500_Signals_22-10-10.png
    SP500_Signals_22-10-10.png
    68.4 KB · Views: 496
  • GLD_22-10-10.png
    GLD_22-10-10.png
    143.8 KB · Views: 2,067
  • GLD_Signals_22-10-10.png
    GLD_Signals_22-10-10.png
    62.3 KB · Views: 496
Attached is a screenshot of my most recent trade in Vedanta (VED).

Entry Date: 11/10/10
45 Shares
Entry Price: £22.14
Entry Commission: £12.50
Stamp Duty: £4.98
Total: £1013.78

Breakeven: £22.79
Target: £29.50
Stoploss: £19.71

Entry Grade: 46%
rValue Zone: Just above the daily value zone
Risk/Reward Ratio: 2.16

The reason I went long in Vedanta is that I think they are a well run company with a strong balance sheet. Their recent statements were positive on their outlook for the coming year and I wanted a play on industrial metals with good emerging market exposure in my portfolio. I scanned the charts of the major miners in the FTSE and Vedantas chart looked like it had the most potential after a good year of consolidation after the big run up last year in the stock.
The technicals looked promising on the weekly and daily charts, and I think the major indices are breaking out of their summer ranges to the upside which should give the miners a boost as they tend to be a leading sector when risk is on at the moment I think.
Anyway hopefully it will be a good buy for my portfolio, but I will be watching for a big pullback if it reaches the downtrend resistance at £25 as looks like it has fairly big sell offs when it does.

thanks for reading

isatrader

Madness 55p you're paying in charges per share. This is crazy and doomed to fail. Why don't you pay the spread on IG instead?
 
Madness 55p you're paying in charges per share. This is crazy and doomed to fail. Why don't you pay the spread on IG instead?

This is my long term portfolio through my tax free ISA account. Trades can be on for months or even years at a time and there is no good options regarding fees with ISA accounts. You either pay them or you don’t trade. I have written another post on this matter talking about the high fees already.

I agree that fees are extortionate for retail investors and that spreadbetting accounts can help active traders with lower costs.

I do have a spreadbetting account through Finspreads, which I use for my more short term trading, as they have much lower minimum positions than IG, which are essential for me for proper risk management of less than 2% risk per share on an small active account.

So I agree with you, and the last two years of trading have made it very clear that I need to trade less in my ISA account and aim for larger moves using weekly charts for targets.

Thanks for the response

isatrader
 
Profit & Loss Update
Some big down moves in the metals this week caused the portfolio to drop by 4.18% in value, and has such brought me back to my breakeven point on the account for the first time in over a year.
The monthly performance is still within acceptable limits as the account is only down 2.69% on a monthly basis, so not particularly worried yet as have 3 fairly new stocks in the account, which will take a while to breakeven and the entry cost on each was higher than the ETFs I usually trade, as I had to pay stamp duty on them all, which you don’t have to pay when trading ETFs. They are all however, long term buys for my portfolio and I hope to get a good 20-30% return on each.

The week ahead
Major economic events I’ll be interested in this week are:
G20 meetings – possible currency market mover

Monday
Existing Homes Sales*

Tuesday
S&P Case-Shiller HPI
Consumer Confidence

Wednesday
Durable Goods Orders*
New Home Sales
EIA Petroleum Status Report

Thursday
Jobless Claims
EIA Natural Gas Report

Friday
GDP*
Employment Cost Index
Chicago PMI
Consumer Sentiment

*most important

As I said in a previous entry. Historically the S&P 500 has made a low near the end of October and achieved an average 4% gain to the year end. So I have my fingers crossed that we have an average or better than average end to the year this year. Although on the negative side the market has already rallied since September on the presumption that the US is going to announce QE2 on 3 Nov, and is now near a major resistance level. I hope they don’t disappoint, as the market would react badly I imagine.

isatrader
 

Attachments

  • PL-Chart_22-10-10.png
    PL-Chart_22-10-10.png
    13.3 KB · Views: 437
October 2010 Month End Update

It’s been a volatile week as expected. My portfolio fell a few percent mid week, but recovered towards the end of the week to end near flat from last week. I took advantage of the big 12% short covering rally in Natural Gas on Friday to finally cut my natural gas holdings. I’m sure it will probably have a huge rally now. But I needed to cut it as has been holding my portfolio back for more than a year and with my re-balancing this month I thought it had to go as I should have cut it over a year ago.

So my portfolio is now very risk on with the following positions in metals, mining and energy:

Nickel ETF (NICK)
Oil ETF 2 Month (OILW)
Palladium ETC (PHPD)
Randgold Resources (RRS)
Fresnillo (FRES)
Vedanta (VED)

The month ended at £7,228.81 – which was -£218.15 down on last month. So -2.93% for October. However, £112.87 of that was fees from my portfolio rebalancing, so not a terrible month really, especially for an October.

So I’m now back just below my breakeven with what I consider to be a strong portfolio. I’ve moved my active trading to my spreadbetting account, so my aim with this portfolio is now to play longer term moves using the weekly and monthly charts for targets to minimise the fees in my ISA account.

Below is my up-to-date trading spreadsheet and my equity curve.
 

Attachments

  • Equity-Curve_29-10-10.png
    Equity-Curve_29-10-10.png
    65.2 KB · Views: 522
  • ISA_Spreadsheet_29-10-10.png
    ISA_Spreadsheet_29-10-10.png
    71.1 KB · Views: 15,409
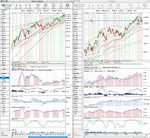
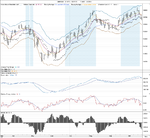
Weekly Market Charts Overview

GBP/USD
The Pound made a good recovery this week finishing the week right back at the 1.60 resistance area for it’s third attempt to breach it. A pattern I like to play is the third attempt on a support/resistance area as these have a tendency to be good breakout points. The weeks action also invalidated the weekly trend line breach from last week for me and my buy signal came on again on Thursday night. The monthly chart seems to confirm the uptrend as it had it’s highest close this year. So I’m now looking for a pullback to value to get long the GBP/USD this coming week with a target for the move to continue towards the 1.65 area.

S&P 500
Another indecisive week for the S&P 500 with no real direction. The warning signals are getting stronger and there’s a big week ahead of news and data, so I’ve tightened stops on my active account. As this could go either way this week once the QE2 announcement is made.

Long term using the monthly chart it looks like it’s made a clear breakout in October. But these are often re-tested so although it looks bullish at the moment a strong pullback could change that.

Gold
A good turnaround week for gold. It pulled itself back above the rising trendline and showed some strength. Short and Medium term are both looking promising to me again. Monthly, it broke above the bearish wedge, so I’m still bullish and am hoping it can reach my target of between $1400 to $1500.

Attached below are all the charts for these.
 

Attachments

  • GBPUSD_29-10-10.png
    GBPUSD_29-10-10.png
    136.4 KB · Views: 479
  • GBPUSD_Monthly_29-10-10.png
    GBPUSD_Monthly_29-10-10.png
    69.7 KB · Views: 487
  • SP500_Monthly_29-10-10.png
    SP500_Monthly_29-10-10.png
    73.8 KB · Views: 437
  • SP500_29-10-10.png
    SP500_29-10-10.png
    146.7 KB · Views: 461
  • GLD_Monthly_29-10-10.png
    GLD_Monthly_29-10-10.png
    57.5 KB · Views: 384
  • GLD_29-10-10.png
    GLD_29-10-10.png
    145.8 KB · Views: 477
The Week Ahead

It’s a big news week with the mid-term elections results and the FED announcement, so I’m not planning on doing too much until there’s a little bit of clarity on direction after the FED decision. But I might get involved early if I see an opportunity ahead of the news.

Economic Data I need to watch most closely this week:

Monday
Personal Income and Outlays*
ISM Manufacturing Index*
Construction Spending

Tuesday
Motor Vehicle Sales

Wednesday
ADP Employment Report
ISM Non-Manufacturing Index
EIA Petroleum Status Report
FED Announcement*

Thursday
Jobless Claims
Productivity and Costs

Friday
Pending Home Sales Index*
Employment Situation*

*most important

So with all the data and the elections, I think there could be a good chance of some volatility. So I might increase my spreadbetting position in the VIX for insurance for my portfolio.
 
Portfolio Month End Charts

Below are the weekly charts of the current portfolio positions:

Nickel ETF (NICK)
Oil ETF 2 Month (OILW)
Palladium ETC (PHPD)
Randgold Resources (RRS)
Fresnillo (FRES)
Vedanta (VED)

Most have been down in October (except Palladium) and are now testing various trendlines. My hope is that they will hold and have a strong finish to year end.
 

Attachments

  • FRES_29-10-10.png
    FRES_29-10-10.png
    53.4 KB · Views: 289
  • RRS_29-10-10.png
    RRS_29-10-10.png
    54.2 KB · Views: 343
  • PHPD_29-10-10.png
    PHPD_29-10-10.png
    44.3 KB · Views: 343
  • OILW_29-10-10.png
    OILW_29-10-10.png
    42.2 KB · Views: 353
  • NICK_29-10-10.png
    NICK_29-10-10.png
    49.8 KB · Views: 319
  • VED_29-10-10.png
    VED_29-10-10.png
    53.1 KB · Views: 304
Weekly Market Charts Overview

GBP/USD
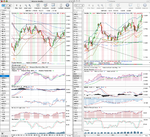
The GBP/USD had a good week. It’s reached it’s daily channel line and reacted back a little bit. This could lead to a short term pullback to value I think, as it has tended to do that in the past. The weekly chart is looking strong, it’s moved away from the long term trend line and there was a crossover of the 22 day EMA and the 50 day EMA to the upside. So another sign the up move could continue in the intermediate term. There is a lot of resistance in the 1.60 to 1.70 zone so I think it could get held in there for a while though.

S&P 500
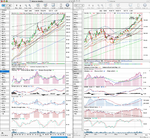
After the deluge of data this week, the mid-terms and the Fed. It was the Fed that really moved the markets the most with the promise of propping up the markets with billions of dollars of cash. It took a while for it to sink in, in the states, but the Asian and European markets rallied strongly on the news and the US followed suit on Thursday. Friday saw some profit taking after the payroll data, but the market recovered in the last 30 mins with some strong buying to close above the April high. The weekly chart, shows the S&P 500 sitting at it long term 61.8% Fibonacci line, so I’m looking for a clear break above that now or this rally could be short lived.

Gold
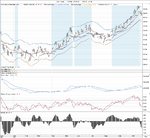
Gold had a wild ride this week, but managed to finish at a new high. The weekly chart shows it the best, but what’s interesting me the most is the breakout above the 0.15 weekly resistance on the rRelative indicator. This is my favourite indicator for identifying support and resistance levels. As it uses the 200 Day SMA as it’s baseline on the daily charts and the 50 week SMA on the weekly chart. The daily indicator is right at resistance, but the weekly has broken out and it’s now only got got 0.22 resistance which it reached on the 27/11/09. So it needs to move 5% away from it’s rising 50 week SMA to be a sell for me now. Which could mean another 10% or more move to the upside for gold, which would take it to the 1500 level. Which would be a definite psychological level for the market I think.
 

Attachments

  • GLD_5-11-10.png
    GLD_5-11-10.png
    141 KB · Views: 243
  • SP500_5-11-10.png
    SP500_5-11-10.png
    142.7 KB · Views: 257
  • GBPUSD_5-11-10.png
    GBPUSD_5-11-10.png
    135.4 KB · Views: 264
Profit & Loss Update

What a week last week turned out to be. My entire portfolio rose by 6.74% from the week before. Which is the best performance my portfolio’s had all year by a long way. I am feeling much better about dumping my natural gas holdings now last week as this weeks move absorbed about 70% of that loss. Some people might think that I might have done the same holding onto the nat gas ETF as spot natural gas rallied this week fairly strongly as well. However, as I found out many times previously, the ETF seriously lags the spot price and has done the same this week again.

The portfolio re-balancing to be more risk on, seems to have have had the desired effect, so I’m hoping for the positive momentum to continue now until year end. The laggards in my portfolio are the 2 Month Oil ETF and Randgold Resources, but the Oil ETF has a similar contango problem that natural gas had, although it is less pronounced as it is based on the oil futures for 2 months out instead of the front month contract. But the dollar move has moved the breakeven up, so even if Oil does rally strongly into year end, I might only get out even. So I will be looking to sell on strength.

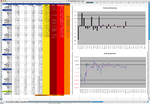
I’ve attached my updated open positions spreadsheet and my equity curve graph below. Lets hope the positive momentum can continue this week.
 

Attachments

  • Open_trades_5-11-10.png
    Open_trades_5-11-10.png
    12.5 KB · Views: 236
  • Equity-Curve_5-11-10.png
    Equity-Curve_5-11-10.png
    65.7 KB · Views: 359
The Week Ahead

Major economic events I need to watch this week are:

Wednesday
International Trade*
Jobless Claims
EIA Petroleum Status Report
Treasury Budget

Friday
Consumer Sentiment

*most important

It looks like a quiet week for data this week. US international trade is the only important event from the US this week, so hopefully the market will be less choppy.
 
Weekend Update

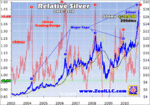
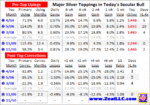
The early strength this week evaporated towards the end of the week. My portfolio got above £8k at one point, so was up around 10%. But dropped back as the week went on to close a little higher than last week at 6.80%. Markets look like they could possibly be rolling over, but am going to hang in there for now as I think it’s a necessary correction for the bull move to go higher in the long term. Gold still looks like it’s got a way to go yet as well as is still 10% lower relative to the 200 day SMA than last years top. I read a really good article from ZealLLC.com on Silver this week and have attached the the charts from their report, as I think they are a really good reference point about whether silver is topping or not.

Economic Data this week

Monday
Retail Sales*

Tuesday
Producer Price Index*
Treasury International Capital
Industrial Production*
Housing Market Index

Wednesday
Consumer Price Index*
Housing Starts*
EIA Petroleum Status Report

Thursday
Jobless Claims
Philadelphia Fed Survey*

*most important

So it’s a busy week for data. Which is why I think it could be volatile as is a lot to focus on. I’ve written up my thoughts on the S&P 500 on my other journal http://www.trade2win.com/boards/trading-journals/106804-spreadbetting-journal-trend-strategy-7.html

Have a good week
 

Attachments

  • Open_trades_12-11-10.png
    Open_trades_12-11-10.png
    10.7 KB · Views: 233
  • Zeal111210A.gif
    Zeal111210A.gif
    47.2 KB · Views: 275
  • Zeal111210B.gif
    Zeal111210B.gif
    25.9 KB · Views: 284
Top