Momentum and Relative Strength

dcraig1

Experienced member
Messages
1,604
Likes
244
I was motivated to start this thread by the following article

Momentum buying can beat the stock market - Telegraph

which pretty much confirms what I had previously thought about relative strength investment/trading strategies ie they do very well in bull markets and conversely relative weakness is an important factor in short stock selection in a bear market.

It seems that all those "idiots" buying Google or such at "absurd" valuations and P/Es are not so stupid after all.

RS strategies (or strategies with RS as an essential component) have been around for a long time and strongly advocated by the likes of O'Neal, Slater etc.

In this thread I would like to discuss stock screening techniques for such strategies and I hope to attract some other contributions or criticisms. Combining them with value screening would be a real plus.

This thread and any lists of stocks on it should not be confused with Greys strong and weak stocks and how to choose them.
 
When I have looked at charts of stocks that are big winners I have frequently been struck by how "smooth" the chart is. To me this suggests that something like rate of change (ROC) may not be the best measure of relative strength of a stock or rather RS may be better defined by something other than ROC.

The Sharpe Ratio is a measure that rewards an investment for growth and punishes it for short term volatility. It seems to be a decent guide to choosing "momentum" stocks.

As a first example I have applied the following screens to grey's strong stock list (as posted, I think by belflan)

Screen1: high sharpe

Sort by descending Sharpe Ratio calculated over the last 250 bars; keep top 50%

Sort remaining by descending Sharpe Ratio calculated over last 65 bars; keep top 8 stocks

Screen2: low sharpe

Sort by ascending Sharpe Ratio calculated over the last 250 bars; keep top 50%

Sort remaining by ascending Sharpe RatioRatio calculated over last 65 bars; keep top 8 stocks

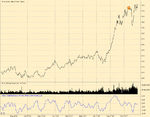
Applying these screens on Jan 1st yields the following results for equally weighted portfolios. The "!" icon denotes the screening date.

First the high sharpe:
 

Attachments

  • high_sharpe.png
    high_sharpe.png
    21.4 KB · Views: 35
Last edited:
Of course these examples while interesting have no statistical validity because of the small sample size, but I will post some more stuff when I have the time.
 
is this at odds with Grey1 value stock stuff

Glen

Not at all. There are many ways to skin a cat.

Amongst other things, I think that regardless of what stock selection techniques one uses, it is absolutely essential to have awareness of market cycles and Grey1 constantly reminds us with the emphasis on MACCI. Also his emphasis on fundamentals of the whole market.

It's also important to be very aware that one can be burnt badly by the wrong RS or momentum stocks when the tide goes out.

Later today, after Yahoo daily data is updated, I'll post a couple of of examples of my initial attempts to combine RS and value stock selection.
 
Here is an example of a purely technical (LONG) screen:

1. Construct unweighted index for each of yahoo industries

2. Sort these indices by 250 bar Sharpe ratio

3. Exclude low volume stocks and stocks priced < $5

4. Select top industries such that they contain 7% of remaining stocks

5. Sort remaining stocks by 250 bar sharpe. take top 50%

6. Sort remaining stocks by 65 bar sharpe. take top 10

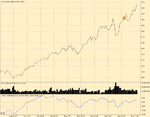
Which gives the following stocks for a screen applied on Jan 31st

WLT, MOS, ADM, DROOY, DE, JRCC, GOLD, CNX, LNN, MON
 

Attachments

  • long_rs_with_sectors_31012008.png
    long_rs_with_sectors_31012008.png
    18.7 KB · Views: 24
And a LONG screen including some "fundamentals"

1. Exclude low volume and stocks < 5$

2. Sort remaining stocks by the Yahoo finance "surprise" factor (in descending order) which is the % by which last quarterly earnings report exceeded or missed analysts
estimates. Keep top 10%

3. Sort remaining by 250 day sharpe (descending). Keep top 50%

4. Sort remaining by 65 day sharpe (descending). Keep top 50%.

5. Sort by yahoo enterprise value / Market Cap. Take top ten.

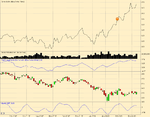
which gives the following stocks for a 31/1/2008 screen

OFG, TVL, XIDE, CWEI, CPE, LBTYA, NWS, WLT, OI, IRM
 

Attachments

  • long_surprise_rs_value_31012998.png
    long_surprise_rs_value_31012998.png
    21.9 KB · Views: 25
Great work dc this all helps and it looks like you have the start of a workable model. I think as Grey1 has said that using a basket trading approach will reduce risk which would be ideal for this as well. When you say exclude low volume stocks at what volume cut off are you excluding ?


Paul
 
Hi Paul,

Definitely intended for basket trading - individual stocks are much too risky. It's risky enough anyway - I reckon some of these stocks have a fairly high beta.

The volume cutoff is quite low. From memory it's something like $1.2M average per day traded over last 20 days. Too thin for daytrading, but maybe OK for swinging. I will probably raise the bar a bit. If you are trading a basket then any single position won't be all that big, so I guess it might be acceptable to sacrifice a little liquidity. Some of the stocks on the above lists are quite liquid eg POT, MON and others.

I think you can probably improve over the mechanical screens by applying a little TA to the selections eg stocks making new highs, breaking thru resistance etc, but there is not a lot in it.

You always need to eyeball charts for issues such as M&A activity that distorts the picture and bad data which crops up surprisingly frequently when scanning 8000 stocks.

Interestingly I've tried screening for PEG (as reported on Yahoo finance) and though highly recommended by Slater and others, I could find no edge. Maybe it's been done to death by now.
 
Last edited:
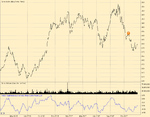
For completeness, here the results of a short screen, which just inverts the logic (ie sort ascending) of the RS + fundies long screen above. Stocks are

MS, UBS, BSC, NYM, KDE, QI, C, ORBK, PGNX, ACTG

Some are a bit thin, but MS, UBS, BSC, and C certainly aren't.
 

Attachments

  • short_surprise_rs_value_31_01_07.png
    short_surprise_rs_value_31_01_07.png
    22.9 KB · Views: 17
Hi Paul,

Definitely intended for basket trading - individual stocks are much too risky. It's risky enough anyway - I reckon some of these stocks have a fairly high beta.

The volume cutoff is quite low. From memory it's something like $1.2M average per day traded over last 20 days. Too thin for daytrading, but maybe OK for swinging. I will probably raise the bar a bit. If you are trading a basket then any single position won't be all that big, so I guess it might be acceptable to sacrifice a little liquidity. Some of the stocks on the above lists are quite liquid eg POT, MON and others.

I think you can probably improve over the mechanical screens by applying a little TA to the selections eg stocks making new highs, breaking thru resistance etc, but there is not a lot in it.

You always need to eyeball charts for issues such as M&A activity that distorts the picture and bad data which crops up surprisingly frequently when scanning 8000 stocks.

Interestingly I've tried screening for PEG (as reported on Yahoo finance) and though highly recommended by Slater and others, I could find no edge. Maybe it's been done to death by now.


out of interest, one mechanical screen I use (from Stock investor pro) is the free cash flow screen;


Those companies in the financial sector and real estate operations industry are excluded
The market capitalization for the latest fiscal quarter (Q1) is greater than or equal to $50 million
The free cash flow per share for the last 12 months and for each of the past five fiscal years is positive (greater than zero)
Note that some companies may have negative free cash flow because of the seasonal nature of their business


This screen has performed awfully over the last year, if applied "mechanically".

However, if the passing companies are further filtered to around 20 stocks using 13 week relative strength, a - 12 month return of -27% is improved to +34%.

Cheers,
UTB

Thanks, I was hoping to attract this sort of comment about experiences with stock screening to this thread. Showing my ignorance here, but what does "free cash flow" equate to on Yahoo finance cash flow page:

CSCO: Cash Flow for CISCO SYS INC - Yahoo! Finance
 
Thanks, I was hoping to attract this sort of comment about experiences with stock screening to this thread. Showing my ignorance here, but what does "free cash flow" equate to on Yahoo finance cash flow page:

CSCO: Cash Flow for CISCO SYS INC - Yahoo! Finance

don't worry, your ignorance will be well surpassed by mine!

Stock investor's definition;

Free cash flow per share for the latest 12-month period and for each of the seven most recent fiscal years. Computed from the statement of cash flow as cash from operations minus capital expenditures minus dividends paid.

Free cash flow per share = (Cash from operations – Capital expenditures – Dividends paid) / Average Shares Outstanding

Not being able to understand this fully, I wouldn't want to translate this into Yahoo speak - you'll do a better job than me:cry:

UTB
 
Interestingly I've tried screening for PEG (as reported on Yahoo finance) and though highly recommended by Slater and others, I could find no edge. Maybe it's been done to death by now.

aaii also follow a successful screen that uses the peg ratio. Interestingly, and I've seen this elsewhere, they exclude companies with a peg of less than 0.2. This is (from memory) because it's distorted by companies who've had a stellar year compared to last year, which was probably ****.

Another common theme with the better screens is companie with earnings upgrades. Worth a look.

UTB
 
A great thread . I am glad to see traders are looking into fundamentals of stocks .

During the webminar I will also show how to mechanically pick stocks from the WEAK or Strong LIST using the WEAK AND STRONG TS CODE..( you can of course choose those with High MACCI and short them but there are other ways which I will advise as the progress is made . I have used this to pick a portfolio for a friend of mine yesterday )

I have had few Pms/ email to tell me they were surprised from the amount of money they made in such a short time using the GROWTH strategy I explained during the first Seminar. I am pleased.

Keep up the good work guys
I invite traders to speak and consult with those who have tried the growth strategy and made money. It is always best to consult with the WINNERS who are here amongst us on this BB.

Grey1
 
Great work dc this all helps and it looks like you have the start of a workable model. I think as Grey1 has said that using a basket trading approach will reduce risk which would be ideal for this as well. When you say exclude low volume stocks at what volume cut off are you excluding ?


Paul
Yes Paul ,, Basket trading of WEAK stocks in the weak market ( and visa versa) reduces the risk and turns the gamble into business. The turn around in trading life of many of my friends whom you know few , has been un believable according to their own statement .

I am going to make similar turn around in my INTRA DAY SEMINAR for those who insist to day trade,,,( Not sure why they insist but never the less I will help as much as I can )


Grey1
 
Following on from the title of this thread, it occurs to me that we could possibly calculate a "value momentum" for a stock which we can use to rank a stock for a "value relative strength" ordering.

Take any fundamental data source such as Yahoo Finance that provides an "Enterprise Value" that is updated reasonably frequently. Yahoo updates daily. Get these values into a time series, sampling at some appropriate interval - maybe weekly, maybe more often.

Calculate the linear regression slope over some period (three months ? 1 year ? 2 years ? or whatever). Divide by the standard error and normalize the result. Hey presto - a ranking for "value momentum" somewhat akin to Sharpe ratio for a price time series.

I've spent a little time eyeballing this data and it seems there might be some merit in the idea.

Any comments ?
 
Sounds good and I will need to re-read your post again to understand how you have done it.


Paul
 
Sounds good and I will need to re-read your post again to understand how you have done it.


Paul

Well, I haven't actually done it yet! I do have a real talent for dreaming up ideas that require work - most frequently without any worthwhile outcome - but I should be able to write the code this week and post anything of real interest.
 
Top